How to Identify Accumulation, Manipulation and Distribution on Any Chart
How to Identify Accumulation, Manipulation and Distribution on Any Chart
Understanding how prices move is very important in trading. Many traders buy or sell when prices break certain levels or follow trading indicators without understanding why the price is moving. Because of this they often enter trades too early fall for fake breakouts or miss big market moves.
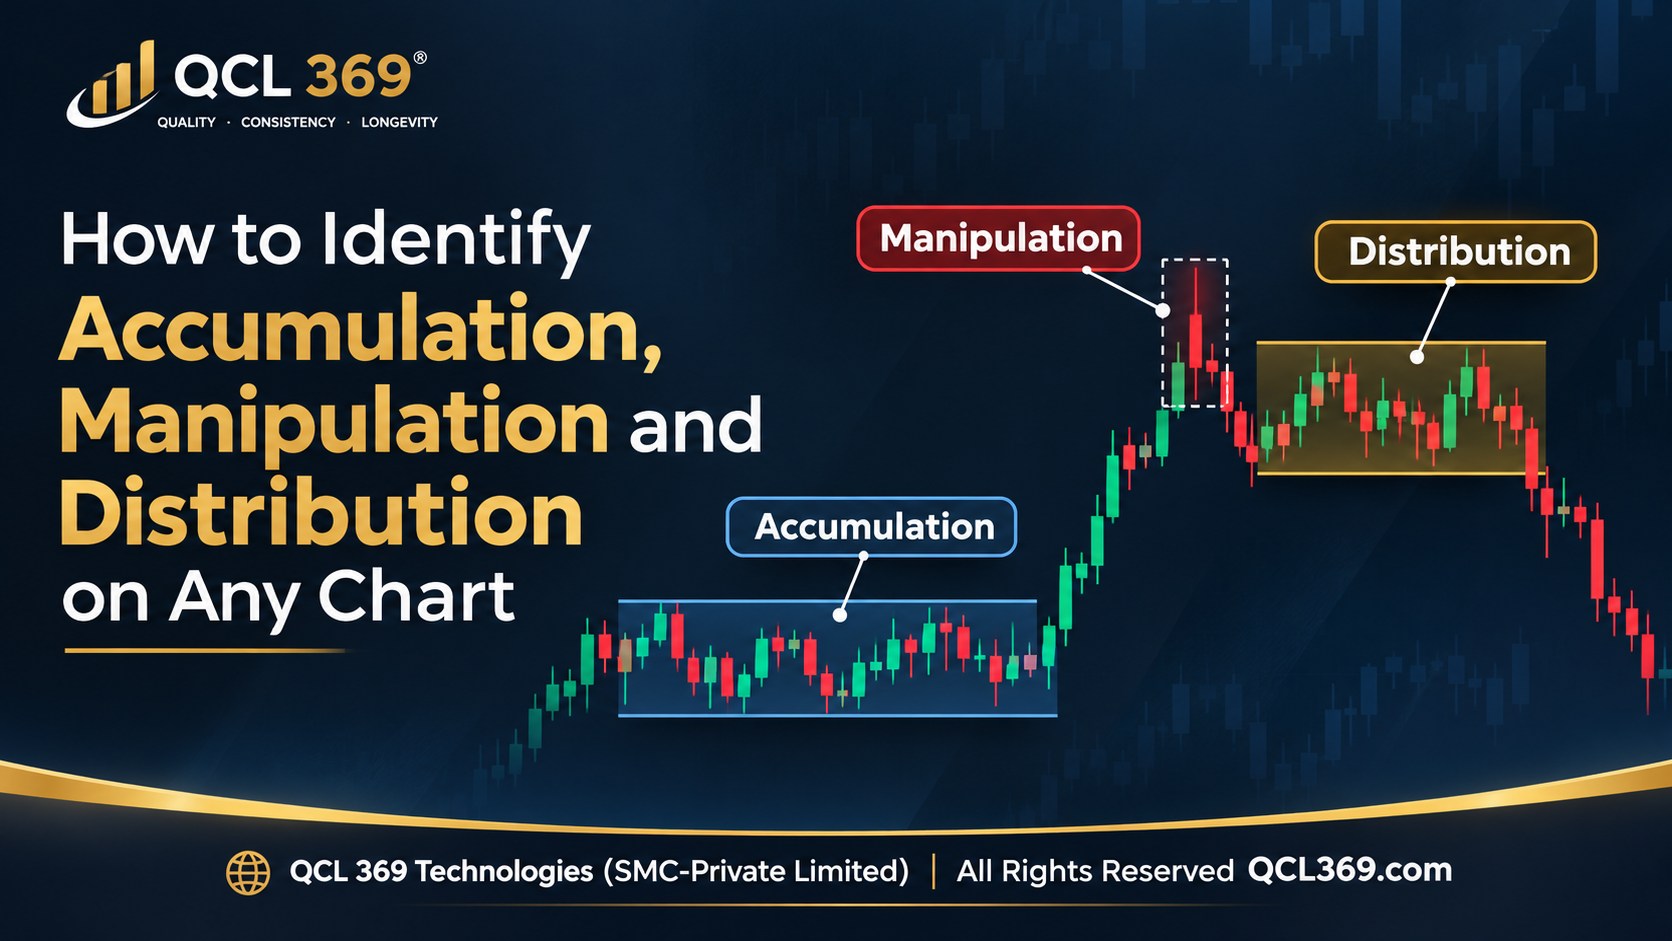
The ICT (Inner Circle Trader) method explains market movements through three stages: Accumulation, Manipulation and Distribution (AMD).
These stages help traders understand when the price moves sideways takes out stop losses and then moves in a clear direction. Learning these stages helps traders better understand forex gold (XAUUSD) indices and other markets.
In this guide we will explain how to spot Accumulation, Manipulation and Distribution on a chart what price movements to look for and how to use the AMD model to find possible trading opportunities.
What Are Accumulation, Manipulation and Distribution (AMD)?
Accumulation, Manipulation, and Distribution are the three main stages of the ICT Power of 3 trading concept.
Each phase describes a different type of market behavior:
-
Accumulation: Price consolidates within a defined trading range.
-
Manipulation: Price moves beyond an important high or low, potentially triggering liquidity.
-
Distribution: Price breaks above a high or below a low to trigger stop losses.
ICT and SMC traders use this concept to understand price movements and spot possible market direction changes.
For example EUR/USD moves between 1.0850 and 1.0880. During the London session the price briefly drops below 1.0850 then quickly reverses and rises toward 1.0900.
An ICT trader may see this as price moving sideways taking out stop losses and then moving up.
Not every market follows AMD. It is not a guaranteed pattern.
1. How to Identify Accumulation on a Chart
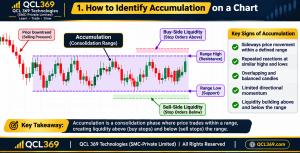
Accumulation is the first phase of the AMD model. It occurs when price moves sideways within a relatively defined range instead of establishing a strong bullish or bearish trend.
During this phase, buyers and sellers interact around similar price levels creating visible highs and lows.
For traders the most important objective is to identify the boundaries of this consolidation.
Key Signs of Accumulation
Look for the following characteristics:
-
Price repeatedly reacts around similar support and resistance levels.
-
Candles overlap and move sideways.
-
Strong directional movement is limited.
-
Multiple short-term highs and lows develop.
-
Price creates identifiable liquidity pools above and below the range.
For example, suppose GBP/USD trades between 1.2700 and 1.2730 for several hours.
The repeated highs around 1.2730 and lows around 1.2700 establish a visible trading range.
Traders may place buy stops above the range and sell stops below it, creating potential liquidity areas.
How to Mark Accumulation
Follow these steps:
-
Identify a period of sideways price movement.
-
Mark the highest point of the consolidation.
-
Mark the lowest point of the consolidation.
-
Observe how frequently price reacts to these levels.
-
Monitor the next session for a potential liquidity sweep.
Important: Accumulation does not always happen during the Asian session. It can develop during any trading session or timeframe.
2. How to Identify Manipulation on a Chart
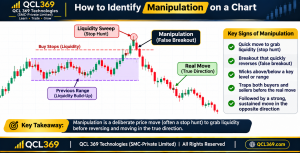
Manipulation is the second phase of the AMD model and is commonly associated with liquidity sweeps and false breakouts.
During this phase price moves beyond an established high or low potentially triggering stop loss orders and attracting breakout traders.
However instead of continuing in the breakout direction price may reverse and move toward the opposite side of the trading range.
Key Signs of Manipulation
Traders should watch for:
-
Price breaking above a previous high or below a previous low.
-
A quick rejection after the breakout.
-
A candle closing back inside the previous range.
-
Strong displacement in the opposite direction.
-
A potential market structure shift (MSS).
Bullish Manipulation Example
Imagine EUR/USD has established an accumulation range:
-
Range high: 1.0880.
-
Range low: 1.0850.
During the London session price drops to 1.0835 moving below the range low.
This move may trigger sell side liquidity and push breakout traders to open short positions.
However, price quickly reverses reclaims 1.0850 and begins moving higher.
This could indicate a potential bullish setup.
Bearish Manipulation Example
Now consider the opposite scenario.
Price consolidates between 1.0850 and 1.0880 before moving above 1.0880 to reach 1.0900.
Instead of moving higher price rejects the breakout falls back below 1.0880 and starts moving down.
This could represent a buy side liquidity sweep followed by potential bearish expansion.
A liquidity sweep doesn’t always mean a reversal or manipulation. Price may break a high or low and keep trending. Always wait for confirmation before entering a trade.
3. How to Identify Distribution on a Chart
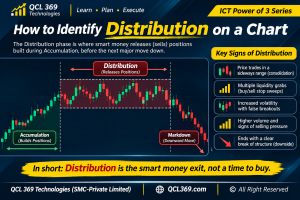
Distribution is the final AMD phase where price moves strongly in one direction after consolidation and a possible liquidity sweep.
This is when traders look to enter the new market move.
Key Signs of Distribution
Look for these characteristics:
-
Strong bullish or bearish displacement.
-
Break of short term market structure.
-
Formation of fair value gaps.
-
Consecutive directional candles.
- Price moves toward previous highs, lows or liquidity targets.
For example after taking the Asian session low EUR/USD starts rising with strong bullish candles.
Price breaks a recent swing high and forms a bullish fair value gap.
An ICT trader may see this as the start of a bullish move.
How to Identify Distribution Targets
Potential price objectives include:
-
Previous session highs and lows.
-
Equal highs and equal lows.
-
Previous daily highs and lows.
-
Higher timeframe fair value gaps.
-
Significant swing points.
The goal is to identify price’s next target not assume the move will continue forever.
How to Identify AMD on Any Timeframe
One benefit of AMD is that traders can use it on different timeframes.
However accumulation, manipulation and distribution can look different on each timeframe.
| Timeframe | How to Use AMD |
|---|---|
| 4-Hour | Identify broader market ranges and directional context. |
| 1-Hour | Identify important liquidity levels and consolidation. |
| 15-Minute | Monitor session ranges and potential liquidity sweeps. |
| 5-Minute | Look for market structure shifts and displacement. |
| 1-Minute | Refine entries after lower-timeframe confirmation. |
Use higher timeframes to understand market direction and lower timeframes to enter trades.
A trader may find a bullish target on the 4-hour chart, watch the Asian range on the 15-minute chart, and confirm entry on the 5-minute chart.
This approach helps traders avoid trades that go against the overall market direction.
How to Trade Accumulation, Manipulation and Distribution
Understanding AMD is important but traders also need a clear trading plan.
Here’s a simple guide to finding AMD trading opportunities.
Step 1: Identify the Market Direction
Start with the 4 hour and 1 hour charts.
Mark important highs, lows, liquidity zones and higher timeframe fair value gaps.
Establish a directional bias instead of trading every liquidity sweep.
Step 2: Mark the Accumulation Range
Identify a visible consolidation range and mark its high and low.
For intraday forex trading traders often use the Asian session range as a key reference.
Step 3: Wait for a Liquidity Sweep
Observe whether price moves beyond one side of the range.
For a bullish opportunity traders may look for a sweep below the range low.
For a bearish opportunity they may look for a sweep above the range high.
Step 4: Confirm the Market Structure Shift
After the sweep use a lower timeframe to look for strong movement and a market structure shift in the opposite direction.
This suggests that price may be starting to move in one direction.
Step 5: Look for a Fair Value Gap Entry
A fair value gap may develop during the displacement.
Traders can wait for price to return to the imbalance before entering in the expected direction.
Step 6: Set Your Stop Loss and Take Profit
For a bullish setup a stop loss may be placed below the relevant swept low.
For a bearish setup it may be placed above the swept high.
Possible profit targets include opposite liquidity previous session highs or lows and higher timeframe levels.
Always calculate your risk before entering a position.
Common Mistakes When Identifying AMD
Even experienced traders make mistakes with AMD. Knowing these mistakes can help improve trading.
1. Treating Every Consolidation as Accumulation
Not every sideways market creates a good setup. Look for clear ranges and consider the overall market direction.
2. Entering Immediately After a Liquidity Sweep
A liquidity sweep alone is not a reversal signal. Wait for displacement or a market structure shift.
3. Confusing Breakouts With Manipulation
Some breakouts represent genuine trend continuation. Do not automatically assume that price will reverse after taking liquidity.
4. Ignoring Higher-Timeframe Bias
A lower-timeframe reversal may occur against a strong higher-timeframe trend. Always analyze the bigger picture.
5. Forcing the AMD Pattern
Not every trading session follows all three phases. Avoid creating setups where clear confirmation is missing.
6. Ignoring Risk Management
No AMD setup guarantees a successful trade. Use appropriate position sizing, stop losses, and realistic profit targets.
Does the AMD Strategy Work on Forex, Gold and Indices?
Yes. The AMD framework can be applied to different financial markets, including forex, gold, and stock indices.
-
Forex: Monitor Asian session ranges, London liquidity sweeps, and potential New York continuation.
-
Gold (XAUUSD): Watch for liquidity sweeps around previous session highs and lows, particularly during periods of increased volatility.
-
Indices: Monitor premarket liquidity and price behavior around the New York session open.
Each market moves differently so adjust your trade size and risk accordingly.
Final Thoughts: Learn to Read the Three Phases of Price Delivery
Accumulation, Manipulation, and Distribution provide traders with a structured way to interpret price movements.
By spotting ranges, watching liquidity sweeps, and waiting for confirmation, traders can make better trading decisions.
The key is not to predict every move. First find the range watch for liquidity sweeps and wait for price to confirm its direction.
The real skill in AMD is knowing when price gives a clear signal to enter a trade not just spotting the three phases.
Frequently Asked Questions (FAQs)
1. What are the three phases of AMD in trading?
The three phases are Accumulation, Manipulation and Distribution. They show how price forms a range, takes liquidity and then moves in one direction.
2. How do you identify accumulation on a chart?
Accumulation is when price moves sideways repeatedly reacting around similar highs and lows to form a clear range.
3. How can you recognize manipulation in forex?
Traders commonly look for price moving beyond a previous high or low, followed by rejection, displacement, and a possible market structure shift.
4. What confirms distribution in ICT trading?
Strong directional displacement, a market structure shift, and movement toward a liquidity objective can provide evidence of potential distribution.
5. What is the best timeframe for the AMD strategy?
There is no universally best timeframe. Many traders use the 1-hour and 4-hour charts for market context and the 5-minute or 15-minute charts for intraday execution.
6. Is AMD the same as ICT Power of 3?
Yes. AMD represents the three phases of the ICT Power of 3 concept: .
7. Can beginners use the AMD trading strategy?
Beginners can learn AMD by studying ranges, liquidity sweeps and market structure. They should practice on past charts and demo accounts before trading with real money.