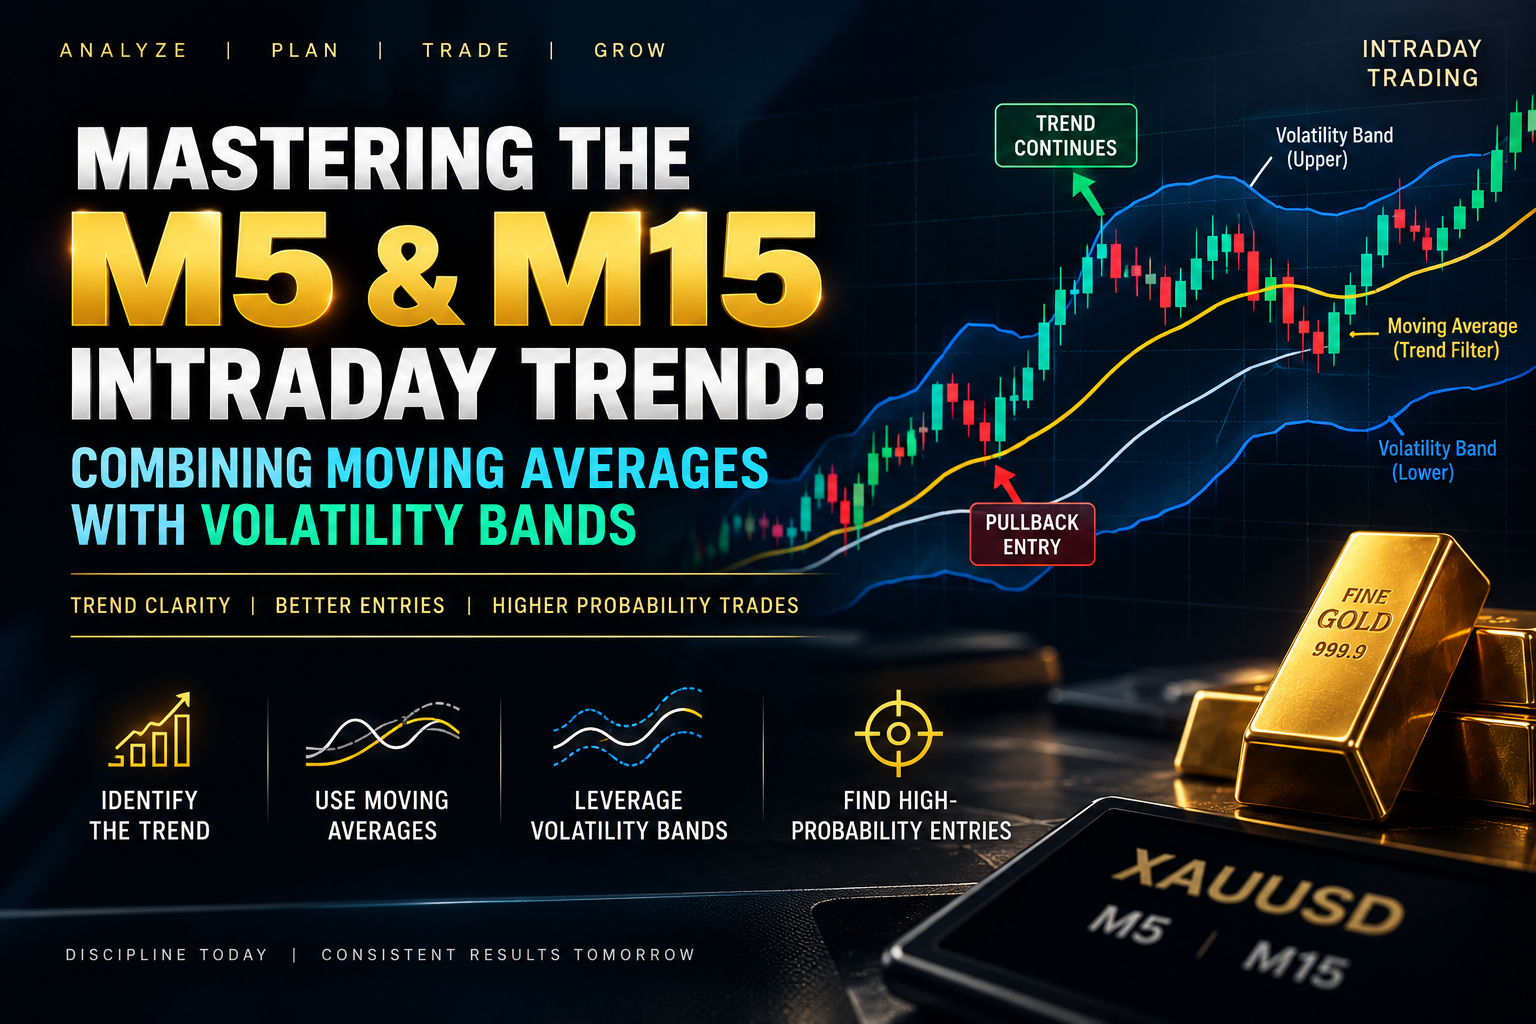
Mastering the M5 & M15 Intraday Trend: Combining Moving Averages with Volatility Bands
M5 & M15 Intraday Trend with Volatility Bands
Trading lower timeframes like M5 and M15 during session opens can feel like navigating a minefield.When London and New York open, liquidity surges, triggering erratic wicks, false breakouts, and rapid stop hunts.
Relying on a moving average or simple breakout trigger often leads to whipsaws.To capture institutional momentum, professional intraday traders combine moving averages for directional bias with volatility bands for momentum confirmation.
London & New York Session Noise
Session opens represent the daily transition of interbank capital. During the London Open (07:00–09:00 GMT) and New York Open (12:00–14:00 GMT), algorithms run price toward local swing levels to fill large orders.
[Session Open Bell] ───> [Algorithmic Liquidity Hunt] ───> [Volatility Expansion] ───> [True Trend Sustained]
                                  │                                   │
                           (Retail Whipsaw)                  (Institutional Volume)
Retail indicators often fail because they measure either price direction or price speed but rarely both:
-
Moving Average Trap: Moving averages lag behind the market. During sudden opening expansions, moving average crossovers often signal entries after the initial push, causing traders to buy the top or sell the bottom.
-
Volatility Band Solution: Dynamic bands based on ATR provide boundaries around price. Instead of entering when price crosses an average, traders wait for price to break into an active expansion band, confirming genuine volume.
M5 & M15 Execution Strategy
To trade session opens without falling victim to opening chop, follow a disciplined three-pillar framework:
1. Macro Bias via Trend Envelopes
Establish structural direction on the M15 chart. If price sustains higher lows above trend smoothing, look for longs; if price prints lower highs beneath trend resistance, prioritize shorts.
2. Volatility Gate
Never enter within the center of a consolidation range. An actionable entry requires price to cross the outer threshold of a volatility-adjusted band, confirming institutional participation rather than retail churn.
3. Strict Confirmation-at-Close
Never enter on an active candle. Wick spikes frequently pierce volatility thresholds and retrace before the candle finishes. Valid momentum is confirmed when the candle closes outside the band, locking in directional commitment.
Non-Repaint Buy Sell QCL MT5 Indicator
Manually tracking moving averages and calculating dynamic ATR bands during volatile session opens can lead to analysis paralysis. The Non-Repaint Buy Sell QCL MT5 Indicator automates this workflow on MetaTrader 5.
Using a proprietary 10-filter confidence scoring engine, the indicator filters out noise and plots verified institutional zones directly onto the workspace:
-
Dynamic Price Smoothing & Volatility Thresholds: The indicator replaces lagging retail indicators with mathematical smoothing and initiates setups when momentum breaks past its custom volatility model.
-
Confirmation at Close Calculation: The software never repaints. Signals lock in at candle close, keeping historical data fixed and eliminating phantom arrows.
-
Live Market Dashboard: A Dark Charcoal & Gold interface delivers real-time session tracking, ATR volatility badges (Low, Normal, High), and multi-target price targets.
M15 Gold (XAUUSD) New York Breakout
The power of combining trend direction with volatility bands is shown in the verified live trade on XAUUSD (Gold) on the M15 chart:
==============================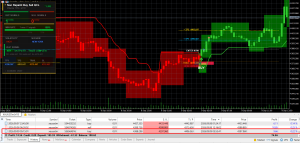
1. Filtering the Bearish Trend
Throughout the preceding hours, the chart printed a distinct Red Bearish Zone, tracking downward distribution. While retail traders attempted premature bottom fishing, the QCL engine remain quiet keeping traders out of counter trend noise until true reversal conditions appeared.
2. New York High Volatility Shift
Entering the New York session aggressive institutional buying swept the lows and displaced price upward through structural resistance.
-
The engine detected an ATR surge, updating the dashboard volatility badge to HIGH and the active session to NEW YORK.
-
As the candle crossed above the volatility band, the structural zone flipped from Red to Green, confirming supply had turned into bullish support.
- At candle close, a permanent BUY Arrow printed with an “ENTER NOW” label at 4388.298, mapping the trade parameters without manual calculation.
3. Multi-Target Trade Management
Managing an intraday trade requires protecting capital while giving winners room to run:
-
Entry Execution: Position opened at the close confirmation price of 4388.298 with a protective Stop Loss anchored at 4372.427.
-
TP1 Hit ($4396.587$): Price pushed swiftly into the first target level, banking a 50% partial close to take risk off the table and secure profit.
-
Trailing Stop Activation ($4375.447$): Once TP1 was tagged, the dynamic trailing stop automatically engaged, locking in profits on the remainder of the position.
-
TP2 Hit ($4405.647$): Continued New York momentum carried price directly into the final expansion target, prompting the terminal dashboard to register
OK TP2 HIT -- TRADE COMPLETEwith a 100% win-rate reading for the session. -
Terminal History: MetaTrader 5 trade ticket
#556564816verifies the disciplined execution, closing out a 0.01 lot position for a clean intraday profit.
Professional Takeaways for Traders
-
Trade the Session, Not the Clock: High-probability intraday expansions occur during institutional overlap windows focus M5 and M15 execution around London and New York session volume.
-
Let Bands Confirm the Trend: A moving average indicates direction, while volatility bands confirm participation. Enter only when price closes decisively beyond structural boundaries.
-
Automate Profit Taking: Use a two-tiered exit strategy bank 50% at TP1 for a risk-free trade, then trail the remainder to TP2 to capture the full intraday trend.