Market Structure in SMC: BOS vs CHoCH Explained (With Chart Examples)
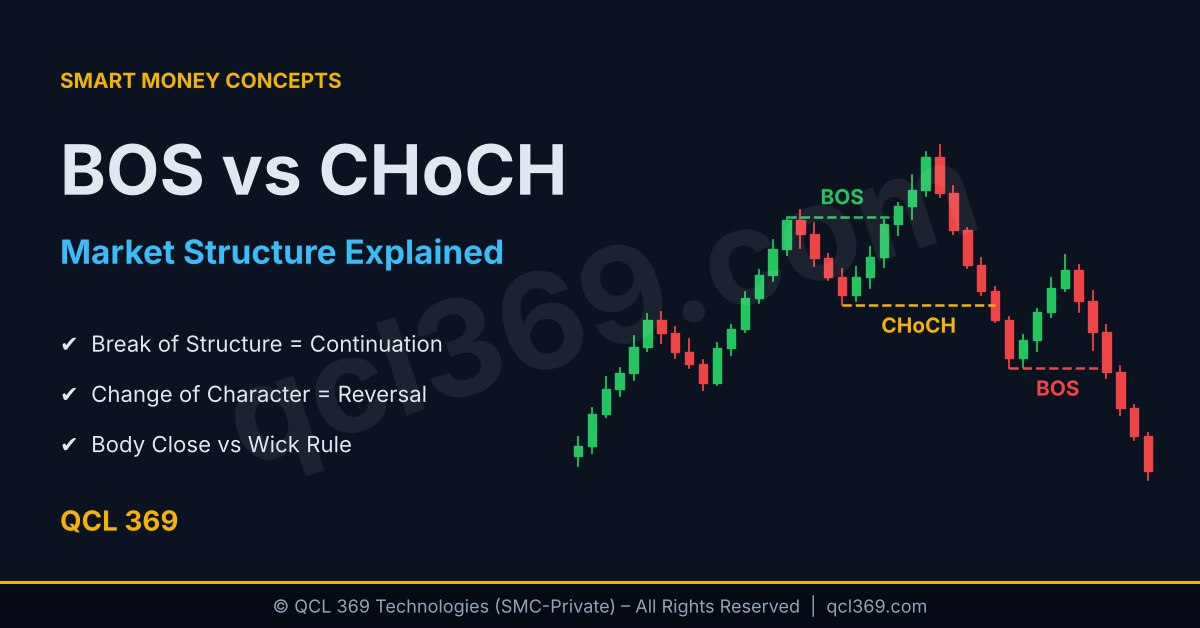
Market Structure in SMC: BOS vs CHoCH Explained for Beginners
Every Smart Money Concepts (SMC) strategy order blocks, fair value gaps, liquidity sweeps and Power of 3 starts with one thing market structure. If you read the structure wrong every zone you mark next will be wrong too.
The two terms you’ll hear most are BOS (Break of Structure) and CHoCH (Change of Character). They look similar on a chart because both happen when price breaks a swing point. But they have different meanings:
- BOS says: “The current trend is continuing.”
- CHoCH says: “The current trend may be ending.”
In this guide you’ll learn how to find swing points, tell BOS and CHoCH apart, identify valid breaks and use these signals to plan trades.
What Is Market Structure?
Market structure is simply the pattern of highs and lows that price forms as it moves.
- A swing high is a peak where price turns down.
- A swing low is a trough where price turns up.
By comparing each new high and low with the previous ones we get four types:
| Label | Meaning |
|---|---|
| HH – Higher High | Price made a peak above the previous peak |
| HL – Higher Low | Price pulled back but stayed above the previous low |
| LH – Lower High | Price rallied but failed below the previous high |
| LL – Lower Low | Price dropped below the previous low |
From these the trend is easy to define:
- Bullish structure (uptrend): a series of HH and HL
- Bearish structure (downtrend): a series of LH and LL
- Range / consolidation: price swings between a fixed high and low without making new ones
Key idea: In SMC we identify the trend by looking at which swing points price breaks not by using moving averages or indicators.
What Is a Break of Structure (BOS)?
A Break of Structure (BOS) happens when price breaks a previous swing point in the direction of the current trend.
- In an uptrend a BOS is when price closes above the most recent Higher High.
- In a downtrend a BOS is when price closes below the most recent Lower Low.
A BOS shows that buyers (in an uptrend) or sellers (in a downtrend) are still in control. It signals that the trend is likely to continue.
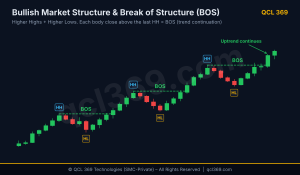
Bullish market structure showing higher highs, higher lows and a Break of Structure (BOS) in SMC.
How traders use a BOS
After a bullish BOS, SMC traders don’t chase the breakout candle. They wait for price to pull back into the move that caused the break usually to an order block or fair value gap in the discount zone. Then, they look for a buy entry in the direction of the trend.
What Is a Change of Character (CHoCH)?
A Change of Character (CHoCH) happens when price breaks a swing point against the current trend. It is the first sign that the trend may be changing direction.
- In an uptrend a CHoCH happens when price closes below the latest Higher Low (the low that led to the last Higher High).
- In a downtrend a CHoCH happens when price closes above the latest Lower High (the high that led to the last Lower Low).
Think of it this way in an uptrend the Higher Low is the level buyers have been protecting. When price breaks below it the market may be changing direction showing that sellers are gaining strength for the first time.
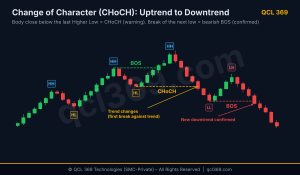
CHoCH in SMC showing an uptrend changing direction after price breaks below the last Higher Low.
Important: a CHoCH is a warning, not a guarantee
A single CHoCH doesn’t mean you should change your bias and start selling right away. It simply means:
- Stop looking for buys in the old trend.
- Watch for a pullback (a new Lower High) to form.
- Wait for a BOS in the new direction to confirm the reversal.
CHoCH = first break against the trend. BOS after CHoCH = the new trend is confirmed.
BOS vs CHoCH: The Key Differences
| BOS (Break of Structure) | CHoCH (Change of Character) | |
|---|---|---|
| Direction | With the trend | Against the trend |
| Swing Break | Latest HH (uptrend) / latest LL (downtrend) | Latest HL (uptrend) / latest LH (downtrend) |
| What it signals | Trend continuation | Possible trend reversal |
| Occurrence Rate | Many times in a trend | Once, at the turning point |
| Typical action | Wait for pullback, trade with trend | Stop trend trades, wait for confirmation |
What Makes a Break “Valid”? Body Close vs Wick
This is where most beginners make mistakes. A wick going above a high does not always mean a break of structure.
- Valid break: a candle body closes beyond the swing point.
- Not a valid break: only the wick goes beyond the swing point and the candle closes back inside.
When a wick moves above a high but closes back below it, it’s usually a liquidity sweep. This means price takes out stop losses above that high but fails to break it. A sweep often happens before price moves in the opposite direction.
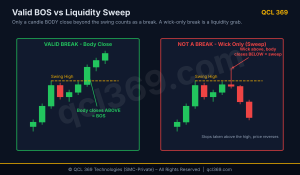
Valid break of structure with candle body close versus invalid break with only a wick, liquidity sweep
Rule of thumb: Body close = structure break. Wick only = liquidity grab.
Internal vs External Structure (Quick Overview)
Market structure exists on every timeframe, and even a single move contains smaller swings.
- External (swing) structure: the major highs and lows that define the main trend.
- Internal structure: the smaller swings inside a pullback or leg.
An internal CHoCH can happen during a normal pullback in a strong uptrend. It doesn’t always mean the main trend is ending. That’s why you need to know which level of market structure you’re trading. We’ll explain this more in a later article about internal vs. external structure.
Using BOS and CHoCH Across Timeframes
A simple top down approach:
- Higher timeframe (H4 / Daily): Mark the external structure. Is the trend bullish or bearish? This is your bias.
- Lower timeframe (M15 / M5): Wait for price to pull back into a higher timeframe zone then look for a CHoCH on the lower timeframe in the direction of your higher timeframe bias.
- Entry: Enter on the pullback after that lower-timeframe CHoCH, ideally from an order block or fair value gap.
Example: The Daily chart is bullish, and price pulls back into a Daily discount zone. On the M15 chart price is moving down then forms a bullish CHoCH. This signals that the pullback may be over and the higher timeframe uptrend may continue.
Common Mistakes to Avoid
- Counting wicks as breaks. Always wait for a candle body close.
- Treating every CHoCH as a reversal. One CHoCH is a warning; wait for a BOS in the new direction.
- Mixing timeframes. An M5 CHoCH is not very important against a strong Daily trend unless price reaches an important Daily level.
- Marking too many swings. Focus on clear swing points. If it’s hard to see it’s probably not important.
- Chasing the breakout candle. The best entry is usually after price pulls back from the break.
Frequently Asked Questions
What is the difference between BOS and CHoCH in simple words?
BOS is a break in the same direction as the trend (continuation). CHoCH is the first break against the trend (possible trend change).
Is CHoCH the same as MSS (Market Structure Shift)?
They are closely related. ICT traders often use “MSS” when price shifts structure with a strong move. We’ll explain the differences in a separate article.
Which timeframe is best for market structure?
Use a higher timeframe (H4 or Daily) for bias and a lower timeframe (M15 or M5) for entries.
Should I use a wick or a body close to confirm a break?
A candle body close. A wick only break is usually a liquidity sweep.
Conclusion
Market structure is the base of Smart Money Concepts. Once you understand swing highs and lows:
- BOS tells you the trend is continuing look for pullback entries in the same direction.
- CHoCH tells you the trend may be changing stop trading the old direction and wait for confirmation.
- Body closes separate real breaks from liquidity sweeps.
Practice marking BOS and CHoCH on a clean chart every day. After a few weeks you’ll start spotting market structure easily and other SMC concepts like order blocks and fair value gaps will become much easier to understand.
In the next article we’ll cover Liquidity in Trading: Buy-Side vs. Sell-Side Liquidity the fuel behind every break in market structure.
Risk Disclaimer: Trading forex indices and other leveraged products involves high risk and may not be suitable for everyone. This article is for educational purposes only and does not provide financial advice.
Related Readings
1- Why a VPS is Important for EA Trading and How to Set It Up on MetaTrader 5
2- How to Trade High Impact News Events Without Getting Banned by Your Prop Firm?
3- Step by Step Guide How to Backtest an MT5 EA Accurately Using Every Tick Data