πŸ”₯ LIVE PROFITS:
Live Profit Stream and Myfxbook live records are displayed below. Please scroll down to view and monitor real-time performance -------- Live Profit Stream and Myfxbook live records are displayed below. Please scroll down to view and monitor real-time performance -------- Live Profit Stream and Myfxbook live records are displayed below. Please scroll down to view and monitor real-time performance --------

Initializing QCL Engine...

πŸ‘€ By Aqsa Ahsan Indicators

How to Trade FOMC News? Surviving the Rate Hike Volatility Trap
How to Trade FOMC News? Surviving Rate Hike Volatility

The Federal Open Market Committee FOMC interest rate decision and Federal Funds Rate policy statement create extreme volatility in the financial markets. For Gold XAUUSD traders an FOMC rate hike or surprise can cause 300 to 600 pip moves in minutes.

Big traders see the FOMC release as a good trading chance while most retail traders treat it like a gamble. Knowing how FOMC news can trap traders and waiting for the first 30 minutes can help you avoid bad trades and find clean trends.

Mistakes That Retail Traders Make During FOMC

Most retail traders approach the FOMC rate decision with impulsive habits that play directly into institutional hands.


[2:00 PM EST: Rate Decision] ───> [Liquidity Evaporates / Spreads Widen] ───> [Two-Sided Whipsaw Wicks] ───> [2:30 PM EST: Press Conference]
                                                 β”‚                                                β”‚
                                        (Retail Stop-Outs)                             (Real Institutional Trend)

1. Gambling on the FOMC Release

Entering a trade right before FOMC release is very risky . When the news comes out trading bots react in seconds and prices can move very fast. Attempting to manually click Buy or Sell can make you enter at the bad price.

2. Ignoring Spread and Slippage

During FOMC news big banks may reduce their market quotes. This can make Gold spreads much wider than normal. A tight Stop Loss can then close your trade even when the real price does not reach your level.

3. Trapped by the Fake Out First Move

The first price move at 2 PM EST is often not the real market direction. Major banks and market makers may push price toward nearby retail Stop to collect liquidity from both sides of the market.

The First FOMC Statement at 2 PM can change or become clearer during the press conference 30 minutes later. A rate hike may first push Gold down but comments from the chair can then cause a strong reversal.

The Golden Rule Wait 30 Minutes

Professional desks do not gamble on the 2:00 PM candle. The institutional edge forms 30 minutes post releaseΒ once:
  • The initial liquidity grab has cleared out weak hands.
  • Spreads have contracted back to standard baseline levels.
  • The market has absorbed the policy statement and press conference tone allowing clear mathematically valid order flow to emerge.

Systematic Execution with the Non-Repaint Buy Sell QCL MT5 Indicator

The Non-Repaint Buy Sell QCL MT5 Indicator was engineered to prevent emotional reactions to news wicks. The indicator uses 10 filters with strict close confirmation and waits for the candle to close. It confirms volume before showing exact entry Stop Loss and target levels.
β”Œβ”€β”€β”€β”€β”€β”€β”€β”€β”€β”€β”€β”€β”€β”€β”€β”€β”€β”€β”€β”€β”€β”€β”€β”€β”€β”€β”€β”€β”€β”€β”€β”€β”€β”€β”€β”€β”€β”€β”€β”€β”€β”€β”€β”€β”€β”€β”€β”€β”€β”€β”€β”€β”€β”€β”€β”€β”€β”€β”€β”€β”€β”€β”€β”€β”€β”€β”€β”€β”€β”€β”€β”€β”€β”€β”€β”€β”€β”€β”€β”€β”€β”
β”‚                      NON-REPAINT BUY SELL QCL β€’ DASHBOARD                       β”‚
β”œβ”€β”€β”€β”€β”€β”€β”€β”€β”€β”€β”€β”€β”€β”€β”€β”€β”€β”€β”€β”€β”€β”€β”€β”€β”€β”¬β”€β”€β”€β”€β”€β”€β”€β”€β”€β”€β”€β”€β”€β”€β”€β”€β”€β”€β”€β”€β”€β”€β”€β”€β”€β”€β”€β”¬β”€β”€β”€β”€β”€β”€β”€β”€β”€β”€β”€β”€β”€β”€β”€β”€β”€β”€β”€β”€β”€β”€β”€β”€β”€β”€β”€β”€
β”‚ Active Session:         β”‚ Volatility Regime:        β”‚ Daily Win Rate:           β”‚
β”‚ β€’ NEW YORK              β”‚ β€’ HIGH (Post-News Flow)   β”‚ β€’ 100% (1 wins / 1 trade) β”‚
β”œβ”€β”€β”€β”€β”€β”€β”€β”€β”€β”€β”€β”€β”€β”€β”€β”€β”€β”€β”€β”€β”€β”€β”€β”€β”€β”΄β”€β”€β”€β”€β”€β”€β”€β”€β”€β”€β”€β”€β”€β”€β”€β”€β”€β”€β”€β”€β”€β”€β”€β”€β”€β”€β”€β”΄β”€β”€β”€β”€β”€β”€β”€β”€β”€β”€β”€β”€β”€β”€β”€β”€β”€β”€β”€β”€β”€β”€β”€β”€β”€β”€β”€β”€
β”‚ ACTIVE TRADE LEVELS:                                                            β”‚
β”‚ β€’ Entry Price:          4325.250 (Triggered on confirmed candle close)          β”‚
β”‚ β€’ Dynamic Stop Loss:    4302.531 (Anchored safely below news rejection low)     β”‚
β”‚ β€’ Target Profit 1 (TP1):4334.904 [HIT - 50% Position Banked]                    β”‚
β”‚ β€’ Dynamic Runner Trail: 4306.578 [Engaged Post-TP1]                             β”‚
β”‚ β€’ Target Profit 2 (TP2):4347.044 [HIT - TRADE COMPLETE]                         β”‚
β””β”€β”€β”€β”€β”€β”€β”€β”€β”€β”€β”€β”€β”€β”€β”€β”€β”€β”€β”€β”€β”€β”€β”€β”€β”€β”€β”€β”€β”€β”€β”€β”€β”€β”€β”€β”€β”€β”€β”€β”€β”€β”€β”€β”€β”€β”€β”€β”€β”€β”€β”€β”€β”€β”€β”€β”€β”€β”€β”€β”€β”€β”€β”€β”€β”€β”€β”€β”€β”€β”€β”€β”€β”€β”€β”€β”€β”€β”€β”€β”€β”€β”˜

Live Execution Breakdown Capturing the Post FOMC Trend on M15 Gold

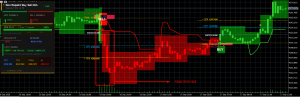
The verified live chart above illustrates how the indicator navigated the FOMC Rate Hike Event on XAUUSD (Gold) on the 15 Minute (M15) timeframe:


========================================================================================
                          POST-FOMC TRADE EXECUTION BLUEPRINT
========================================================================================
 Asset / Timeframe:       XAUUSD (Gold) | 15-Minute (M15)
 Event Trigger:           FOMC Rate Hike Release Window
 Active Session:          NEW YORK
 Volatility Status:       HIGH (Verified ATR Expansion)

 [PROJECTED TRADE TARGETS]
 Target Profit 2 (TP2):   4347.044  (Terminal Hit -- OK TP2 HIT -- COMPLETE)
 Target Profit 1 (TP1):   4334.904  (Primary Target -- HIT, 50% Banked)
 Dynamic Runner Trail:    4306.578  (Trailing Stop Protection Locked)
 Entry Confirmation:      4325.250  (ENTER NOW Blueprint confirmed on close)
 Dynamic Stop Loss (SL):  4302.531  (Plotted below volatility boundary)
========================================================================================

1. FOMC Flush and Absorption

At 18:00 server time the FOMC Rate Hike decision caused a strong drop in price shown by the red FOMC RATE HIKE box. Retail traders buying prematurely were liquidated.
The indicator’s algorithmic engine tracked the move painting a Red Bearish Zone to keep traders on the right side of the flush and preventing bottom fishing while the market dropped past $4250.

2.News Stabilization & Structural Reversal

After the news the strong selling pressure started to slow down. Price moved sideways and formed higher lows before breaking above the previous downtrend channel.

As the market entered the New York continuity window institutional buying accelerated:


  • The previous red supply zone cleared and the workspace shifted into a vibrant Green Bullish Zone.
  • Rather than firing an impulsive mid bar arrow the software waited for the 15 minute bar to close decisively above the dynamic volatility threshold.
  • At the candle close a permanent Green BUY Arrow locked in alongside an ENTER NOWΒ blueprint.

3. Clean Target Delivery TP1 & TP2 Hit

The system auto projected the entire execution structure directly onto the chart with zero manual math:
  • Entry Execution: Triggered at the candle close (~4325.250) with the Stop Loss auto-projected at 4302.531Β positioned below the structural consolidation floor.
  • TP1 Reached ($4334.904): The initial expansion surged into the first target line prompting an immediate 50% partial position close to remove all market risk.
  • Runner Trail Engaged ($4306.578): With TP1 secured the dynamic trail stop engaged to protect unrealized profits on the runner.
  • TP2 Reached ($4347.044): Continued bullish momentum carried price cleanly through the secondary target prompting the live dashboard to log OK TP2 HIT TRADE COMPLETE and displaying a 100% win rate for the session.

FOMC Day Trading Plan

  1. Step Aside for 30 Minutes: Turn off manual execution and let the high impact spikes sweep initial liquidity and normalize broker spreads.
  2. Never Predict the Number: Trade the structural price action that confirms after the Fed speaks not your personal macro bias.
  3. Rely on Non-Repainting Confirmation: Use fixed candle close quantitative tools like the Non-Repaint Buy Sell QCL MT5 Indicator to spot verified institutional volume before deploying risk.