Buy-Side vs Sell-Side Liquidity: Where Smart Money Hunts Stops (With Chart Examples)
Buy-Side vs Sell-Side Liquidity: Where Smart Money Hunts Stops (With Chart Examples)
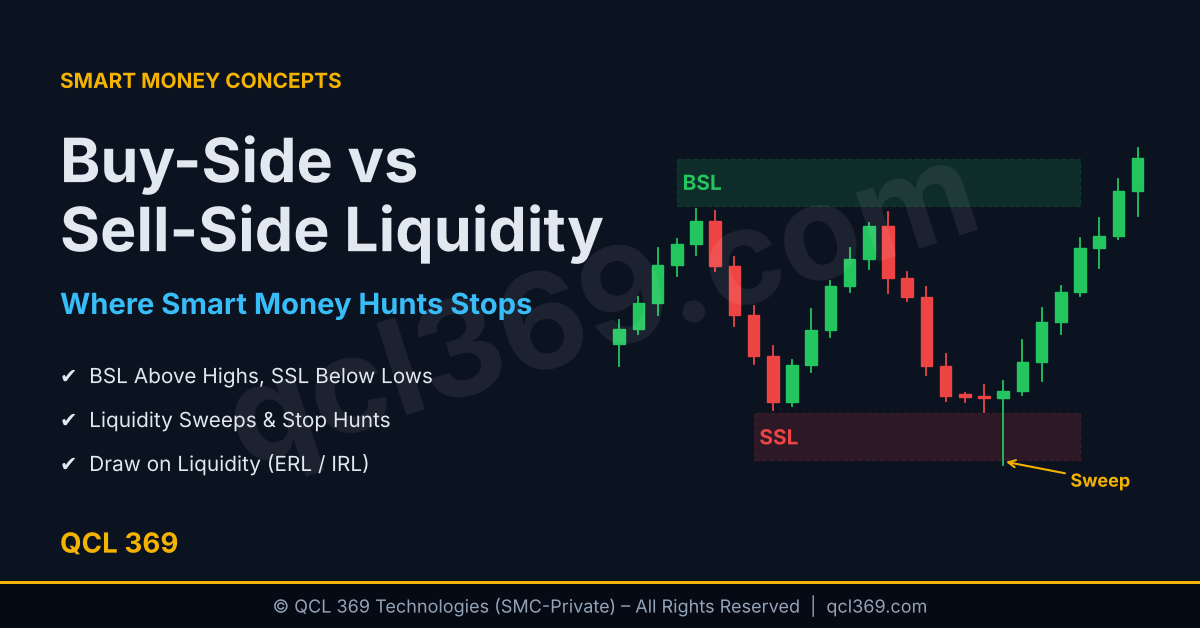
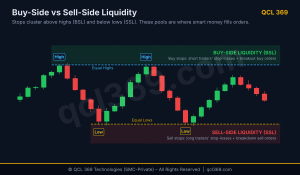
Buy-Side Liquidity (BSL) is where buy-stop orders sit above highs, while Sell-Side Liquidity (SSL) is where sell-stop orders sit below lows. Big traders use these orders to fill large positions so price often moves toward these levels. Once you understand where liquidity is you can trade with smart money instead of becoming their target.
In the previous article we learned how to read market structure using BOS and CHoCH. Liquidity is what drives these breaks. In this guide you’ll learn:
- What liquidity actually means in trading
- The difference between Buy-Side Liquidity (BSL) and Sell-Side Liquidity (SSL).
- Where liquidity pools form on a chart
- How liquidity sweeps work and how to trade them
- What “draw on liquidity” means and how to use it to pick targets
What Is Liquidity in Trading?
Liquidity simply means orders (mainly stop-losses and pending breakout orders) placed around common price levels.
Why does this matter? Big institutions trade huge amounts so they need enough buyers or sellers to complete their trades. They often find these orders around areas where retail traders place their stop-losses.
Key idea: Every stop-loss is an order waiting to be triggered. When many stop-losses gather around one price level it becomes a target for big traders.
What Is Buy-Side Liquidity (BSL)?
Buy-Side Liquidity (BSL) is found above price, mainly above swing highs, equal highs, and previous day or week highs.
Who places orders there
- Sellers (short traders) put their stop-losses above the high. A short trade’s stop-loss is a buy order.
- Breakout traders place buy-stop orders above the high hoping to catch a breakout.
Above every clear high, many buy orders are placed. When price moves above that high, these orders get triggered, giving big traders the buyers they need to sell.
What Is Sell-Side Liquidity (SSL)?
Sell-Side Liquidity (SSL) is found below price, mainly below swing lows, equal lows, and previous day or week lows.
- Buyers (long traders) put their stop-losses below the low. A long trade’s stop-loss is a sell order.
- Breakdown traders place sell-stop orders below the low.
When price moves below that low those sell orders get triggered giving big traders the sellers they need to buy from.
Alt text: Buy-side liquidity above swing highs and sell-side liquidity below swing lows in smart money concepts
BSL vs SSL at a Glance
| Comparison | Buy-Side Liquidity (BSL) | Sell-Side Liquidity (SSL) |
|---|---|---|
| Location | Above highs | Below lows |
| Orders resting there | Buy stops (short stop-losses + breakout buys) | Sell stops (long stop-losses + breakdown sells) |
| Smart money uses it to | Sell / enter shorts | Buy / enter longs |
| After a sweep, look for | Bearish reaction | Bullish reaction |
Where Do Liquidity Pools Form?
Liquidity builds wherever many traders put stops in the same obvious place. The most common pools:
- Equal Highs / Equal Lows when two or more highs or lows are at almost the same price. Traders see them as resistance or support and place stop-losses just above or below them. These are some of the strongest magnets on the chart.
- Swing highs and swing lows every clear swing point holds stops.
- Previous Day High / Low (PDH / PDL) and Previous Week High / Low (PWH / PWL) watched by almost every trader.
- Session highs and lows for example the Asian session range before London opens.
- Trendline liquidity when price touches a trendline three or four times traders place stops just beyond it.
Rule of thumb: The more obvious a level looks to retail traders the more liquidity rests behind it.
Liquidity Sweeps: How Smart Money Grabs Stops
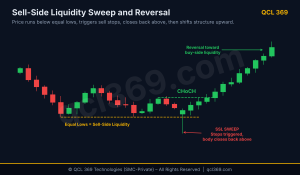
A Liquidity Sweep (also called a Stop Hunt or Liquidity Grab) happens when price briefly moves above a high or below a low, triggers the stop-losses and then reverses in the opposite direction.
A classic bullish sweep looks like this:
- Price forms a clear low (or equal lows) sell-side liquidity builds below.
- Price spikes below that low triggering the sell stops.
- The candle closes back above the low (often leaving a long lower wick).
- Price quickly moves upward often breaking market structure and forming a bullish CHoCH.
Alt text: Sell-side liquidity sweep below equal lows followed by bullish change of character and reversal
Remember the rule from Article #1: a wick beyond a level is a sweep not a break. A sweep followed by a CHoCH in the opposite direction is one of the highest probability setups in SMC.
Sweep vs Real Breakout How to Tell the Difference
| Liquidity Sweep | Real Breakout |
|---|---|
| Wick beyond the level, body closes back inside | Candle body closes firmly beyond the level |
| Quick rejection, often within 1–3 candles | Price holds beyond the level and continues |
| Followed by a CHoCH in the opposite direction | Followed by a BOS in the same direction |
Draw on Liquidity: Where Is Price Going Next?
ICT traders often ask one question before every trade: “What is the draw on liquidity?” In other words which pool of liquidity is price most likely to reach next?
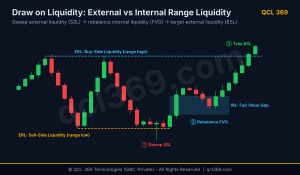
A useful framework is External Range Liquidity (ERL) vs Internal Range Liquidity (IRL):
- External Range Liquidity (ERL): the highs and lows at the edges of the current trading range where BSL and SSL rest.
- Internal Range Liquidity (IRL): imbalances inside the range mainly Fair Value Gaps (FVGs).
Price tends to move between the two:
- After taking external liquidity (a sweep of a high or low) price often retraces into internal liquidity (an FVG).
- After rebalancing internal liquidity price often reaches for the next external liquidity pool.
Alt text: Price moves up after sweeping sell-side liquidity, passes through a fair value gap and targets buy-side liquidity.
This helps you choose your targets easily if you buy after an SSL sweep your next target is the BSL above the range.
How to Trade Liquidity: A Simple Step-by-Step Plan
- Mark the liquidity. On the H1 or H4 chart, mark clear highs, lows, equal highs, equal lows and the previous day’s high and low.
- Decide the draw. se higher-timeframe market structure to decide which side (BSL or SSL) price is more likely to reach next.
- Wait for the sweep. Let price take liquidity on the opposite side first (for a long wait for an SSL sweep).
- Confirm with structure. Drop to M15/M5 and wait for a CHoCH in your intended direction.
- Enter on the pullback. Enter from the order block or FVG created by the move that caused the CHoCH.
- Set stop and target. Stop-loss beyond the sweep wick target the opposing liquidity pool.
Common Mistakes to Avoid
- Putting your own stop exactly at the obvious level. If everyone places stops below the low yours may get hit too. Place it beyond the sweep zone.
- Entering on the sweep candle itself. Wait for a CHoCH. A sweep without a structure change may continue in the same direction.
- Assuming every equal high/low will be swept immediately. Liquidity can stay for days or weeks. It’s a price target not a time signal.
- Ignoring the higher timeframe. An SSL sweep during a strong downtrend is often just a pause not a trend reversal.
- Confusing a real breakout with a sweep. Always check the candle body close.
Frequently Asked Questions
Is buy-side liquidity bullish?
Not always. BSL is simply where buy orders sit. Price often moves toward it but after sweeping it, price may turn bearish.
What is the difference between a liquidity sweep and a stop hunt?
They describe the same event price moving beyond a level to trigger resting stops before reversing.
Why are equal highs and equal lows so important?
They look like strong support or resistance so many traders place stop-losses just beyond them making these areas easy targets.
Which timeframe is best for marking liquidity?
Mark major liquidity on H1, H4 and Daily. Use M15 or M5 to time entries after a sweep.
Conclusion
Liquidity is the fuel of the market. Once you understand it:
- Buy-side liquidity rests above highs sell-side liquidity rests below lows.
- Equal highs/lows swing points and previous day/week levels are the most common pools.
- A sweep + CHoCH in the opposite direction is a powerful reversal setup.
- Draw on liquidity tells you where price is likely heading and gives you a logical target.
Mark BSL and SSL on your chart every morning before trading. You’ll soon notice how often price reaches these levels before making its next big move.
In the next article we’ll learn about Premium and Discount Zones how to know if price is cheap or expensive before entering a trade.
Risk Disclaimer: Trading forex, indices and other leveraged products involves high risk and may not be suitable for everyone. This article is for learning purposes only and is not financial advice.
Related Readings
1- Market Structure in SMC: BOS vs CHoCH Explained (With Chart Examples)
2- How to Trade High Impact News Events Without Getting Banned by Your Prop Firm?
3- Step by Step Guide How to Backtest an MT5 EA Accurately Using Every Tick Data