What Is a Fair Value Gap (FVG)? How to Identify and Trade It (With Chart Examples)
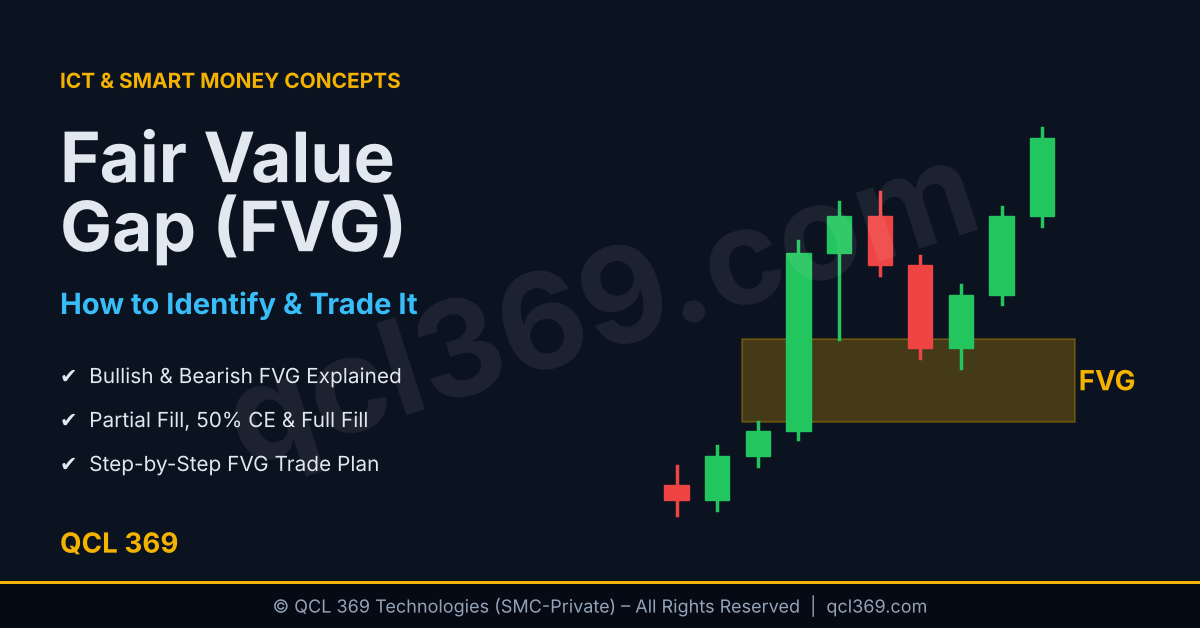
What Is a Fair Value Gap (FVG)? How to Identify and Trade It (With Chart Examples)
A Fair Value Gap (FVG) is a three-candle pattern where the middle candle moves fast leaving an empty space between the first and third candles. Price often comes back to fill this gap making it a popular entry zone in ICT and Smart Money Concepts.
In this guide you’ll learn:
- What a fair value gap is and why it forms
- How to identify bullish and bearish FVGs step by step
- What “filling” or “mitigating” an FVG means
- How to trade an FVG with a clear entry, stop and target
- How to tell a high quality FVG from a weak one
What Is a Fair Value Gap?
In a normal market buyers and sellers trade equally and candles overlap. When a big buyer or seller enters the market, price moves very fast in one direction, leaving an empty space. This is called an imbalance or inefficiency.
ICT calls this area a Fair Value Gap because price moved too fast without equal buying and selling. Price often comes back to these areas making them important zones where price may react.
Key idea: An FVG shows where big buyers or sellers moved the price very fast in one direction.
How Can You Identify a Fair Value Gap (FVG)?
Every FVG uses three consecutive candles:
- Candle 1: the candle before the move
- Candle 2: the big displacement candle
- Candle 3: the candle after the move
Bullish FVG
A bullish FVG forms during a strong move up.
- The gap is the empty space between candle 1’s high and candle 3’s low.
- A bullish FVG forms when candle 3’s low is higher than candle 1’s high.
- It acts as support when price comes back to this zone buyers may start buying again.
Bearish FVG
A bearish FVG forms during a strong move down.
- The gap is between the low of candle 1 and the high of candle 3.
- If candle 3’s high is below candle 1’s low a bearish FVG exists.
- It acts as resistance: when price comes back to this zone sellers may start selling again.
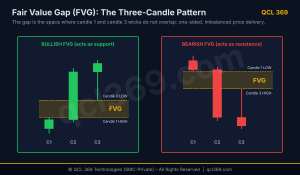
Fair Value Gap diagram showing a bullish gap between candle 1 high and candle 3 low and a bearish gap between candle 1 low and candle 3 high.
Quick Reference
| Bullish FVG | Bearish FVG | |
|---|---|---|
| Forms during | Strong move up | Strong move down |
| Top of gap | Candle 3 low | Candle 1 low |
| Bottom of gap | Candle 1 high | Candle 3 high |
| Acts as | Support | Resistance |
| Trade idea | Buy when price returns into it | Sell when price returns into it |
What Does “Filling” an FVG Mean?
When price comes back to an FVG, traders say it fills or rebalances the gap. There are three common reactions:
- Partial fill: Price touches the edge of the gap and moves away. This shows strong buying or selling.
- Consequent Encroachment (CE): Price reaches the middle (50%) of the gap and then reacts. ICT calls this level the CE which we will explain later.
- Full fill: Price moves through the entire gap, meaning the FVG is fully filled. If a candle closes beyond the gap it may fail and turn into an Inverse FVG.
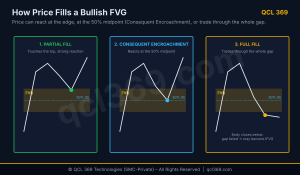
Alt text: Three types of bullish FVG fills partial fill, 50% midpoint (CE) and complete fill.
How Can You Trade a Fair Value Gap (FVG) Step by Step?
An FVG is just a zone on its own. It becomes a trading setup when it matches the concepts we learned in our previous articles.
Bullish FVG trade plan:
- The higher timeframe trend is bullish (as explained in Article #1 about market structure).
- Liquidity: Price takes out the lows to grab sell-side liquidity (as explained in Article #2 about liquidity).
- Displacement: Price moves strongly upward breaks market structure (BOS or CHoCH) and creates an FVG.
- Location: The FVG sits in the discount half of the new range (see Article #3 on premium vs discount).
- Entry: Place a buy limit at the top of the FVG or at its 50% (CE) for a better price.
- Stop-loss: Below candle 1’s low, or below the swing low for extra safety.
- Target: The next buy-side liquidity such as the swing high or equal highs above.
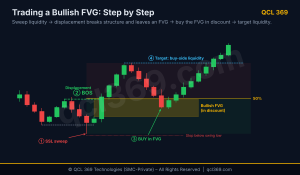
Alt text: Bullish FVG setup showing a liquidity sweep, strong displacement, break of structure and entry at a discount zone FVG.
For a bearish trade reverse the steps bearish bias, buy-side liquidity sweep, bearish displacement, FVG in premium, sell entry, stop above Candle 1’s high and target sell-side liquidity.
How Can You Identify High-Quality vs. Weak Fair Value Gaps (FVGs)?
Not every gap is worth trading. Look for these quality signs:
| High-Quality FVG | Weak FVG |
|---|---|
| Created by strong displacement (big-bodied candles) | Created by a slow, choppy move |
| Caused a BOS or CHoCH | Formed inside a range with no structural break |
| Formed right after a liquidity sweep | No liquidity taken before the move |
| Sits in discount (bullish) or premium (bearish) | Sits in the wrong zone |
| Unmitigated (price hasn’t returned yet) | Already filled one or more times |
| Aligned with the higher-timeframe bias | Against the higher-timeframe trend |
Rule of thumb: The more of the left column an FVG ticks, the higher its probability.
What Common Mistakes Should You Avoid?
- Trading every gap. Ignore random FVGs. Only trade the FVG that caused a Break of Structure (BOS) with strong displacement.
- Ignoring direction. A bullish FVG in a strong downtrend is more likely to fail than hold.
- Placing the stop inside the gap. Normal price movement can wick through the gap. Give your stop room beyond candle 1.
- Entering before price reaches the gap. Be patient and let price come to your zone.
- Forgetting the timeframe. A tiny M1 gap means little against a big H4 FVG nearby.
Frequently Asked Questions
Is a fair value gap the same as an imbalance?
Yes both mean almost the same thing. Imbalance is the general term while FVG is a three-candle gap showing it.
Do all fair value gaps get filled?
No. Some FVGs get filled while others never do especially in strong trends. Always wait for confirmation and manage your risk.
What is the best timeframe for FVGs?
H1 and H4 are good for finding key zones while M15 and M5 are better for entry points.
What’s the difference between an FVG and a normal price gap?
A normal gap means no trading happened between candles. An FVG happens during normal trading when candle wicks don’t overlap.
Conclusion
FVG is a simple but powerful tool in ICT trading.
- An FVG is a three-candle imbalance left by strong one-sided price movement.
- Bullish FVGs act as support bearish FVGs act as resistance.
- The best FVGs form after a liquidity sweep break market structure and appear in the right price zone.
- Enter at the FVG, place your stop beyond candle 1 and target the next liquidity level.
Open a chart and mark only FVGs that broke structure. Watch how often price comes back to them before moving again.
Next, we’ll learn about failed FVGs also known as Inverse Fair Value Gaps (IFVGs).
Risk Disclaimer: Trading forex and other markets can be risky and may not be suitable for everyone. This article is for learning purposes only not financial advice.
Related Readings
1- Premium vs Discount Zones: How to Use Fibonacci the ICT Way (With Chart Examples)
2- Premium vs Discount Zones: How to Use Fibonacci the ICT Way (With Chart Examples)
3- Step by Step Guide How to Backtest an MT5 EA Accurately Using Every Tick Data
About the Author
Aqsa Ahsan is a trader and trading writer at QCL369 with 3 years of hands-on experience in the forex and gold (XAUUSD) markets. She writes practical guides on risk management, prop firm challenges, news trading and Smart Money Concepts, with a focus on the discipline and risk rules that keep trading accounts alive.