Premium vs Discount Zones: How to Use Fibonacci the ICT Way (With Chart Examples)
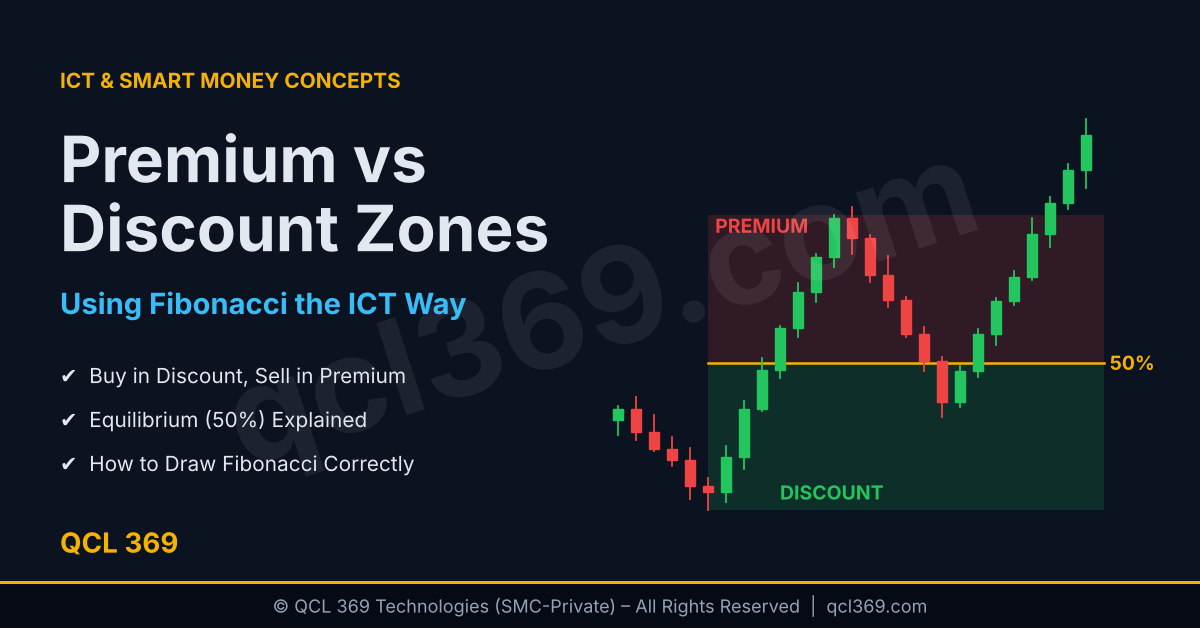
Premium vs Discount Zones in ICT: How to Use Fibonacci the Right Way
In ICT and Smart Money Concepts, the upper half of a price range is called the Premium zone (expensive) and the lower half is called the Discount zone (cheap). Smart money buys in discount and sells in premium. The middle 50% level is called Equilibrium. All three can be found using one simple Fibonacci tool.
This may sound simple, but it helps avoid a common mistake buying high and selling low. In this guide you’ll learn:
- What premium, discount and equilibrium mean
- How to choose the right dealing range
- How to draw the Fibonacci tool correctly for bullish and bearish setups
- How to combine premium/discount with order blocks and fair value gaps
- A worked example with real numbers
What Are Premium and Discount Zones?
Think of shopping. You wouldn’t buy something at full price if you know it often goes on sale. Institutions think the same way about price.
Every price range has three parts:
| Zone | Where | What it means | Smart money action |
|---|---|---|---|
| Premium | Above 50% of the range | Price is expensive | Look for sells |
| Equilibrium | Exactly 50% | Fair price | Usually no new positions |
| Discount | Below 50% of the range | Price is cheap | Look for buys |
Key idea: In an uptrend wait for price to drop into discount before buying. In a downtrend wait for price to rise into premium before selling.
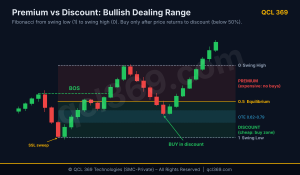
Alt text: ICT premium and discount zones showing a bullish price range 50% equilibrium and a buy entry in the discount zone.
Step 1: Identify the Correct Price Range
A dealing range is the price range used to find premium and discount zones. If you choose the wrong range all the levels will be wrong.
A valid dealing range is a clear swing low to swing high (or high to low) where:
- Structure has broken. In a bullish range price breaks above the previous high (see Article #1 on BOS vs CHoCH).
- Liquidity has been taken. Ideally the swing low takes out sell-side liquidity before the price moves up (see Article #2 on liquidity).
- The range is still “live”. Price is now pulling back inside it and hasn’t broken below the swing low.
Tip: Use the latest important swing on your chosen timeframe. Small swings create small unreliable ranges.
Step 2: How to Set Up the Fibonacci Tool Correctly?
ICT traders strip the Fibonacci tool down to a few levels: 0, 0.5 (equilibrium) and 1 plus the Optimal Trade Entry (OTE) levels 0.62, 0.705 and 0.79 which we’ll cover in detail in a later article.
For a bullish range (looking to buy):
– Draw from the swing low (1.0) to the swing high (0.0).
– Everything below 0.5 is discount which is your buying area.
For a bearish range (looking to sell):
– Draw from the swing high (1.0) to the swing low (0.0).
– Everything above 0.5 is premium which is your selling area.
Easy memory trick: Always draw in the direction of the move. Start at the beginning and end at the finish. This puts the retracement levels on the correct side.
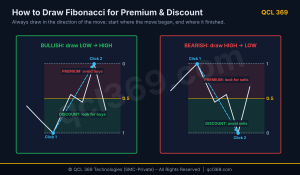
Alt text: How to draw Fibonacci retracement to mark premium and discount zones in bullish and bearish ICT price ranges.
Step 3: How to Combine Premium/Discount with a PD Array?
Premium and discount show you where to look but they don’t give you the exact entry point. For that ICT uses PD arrays (Premium/Discount arrays). These are price zones such as:
- Order blocks (the last opposite candle before a strong move)
- Fair value gaps (FVGs) (three-candle imbalances)
- Breaker blocks and mitigation blocks
The best setups happen when a PD array is inside the correct zone:
- Bullish: a bullish order block or FVG in discount
- Bearish: a bearish order block or FVG in premium
A bullish FVG in the premium zone is a weaker buy entry because you’re buying at a high price.
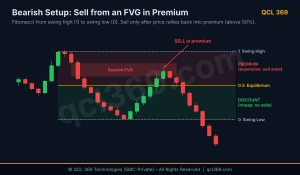
Alt text: Bearish sell setup in the premium zone showing a fair value gap above equilibrium in ICT Smart Money Concepts.
Worked Example (EUR/USD)
Let’s put numbers on it.
- On the H1 chart EUR/USD sweeps sell-side liquidity at 1.0800 then rallies and breaks structure up to 1.0900.
- Dealing range: 1.0800 (low) to 1.0900 (high), a 100-pip range.
- Equilibrium (50%) = 1.0800 + (100 ÷ 2) = 1.0850
- Discount zone: 1.0800 to 1.0850, where you look for buys.
- Premium zone: 1.0850 to 1.0900, where you don’t buy.
- OTE area (62%–79%): about 1.0838 down to 1.0821
Price pulls back to 1.0835 reaching a bullish FVG in the discount zone. On M5 price shows a bullish CHoCH. You enter a buy trade with a stop loss below 1.0800 (the swing low) and target the buy-side liquidity above 1.0900.
This gives a stop loss of about 35–40 pips and a target of 65+ pips. The risk-to-reward is good because you bought in discount instead of buying near the high.
How Does Premium/Discount Work Across Different Timeframes?
Price ranges exist within larger ranges. A discount zone on M15 may still be inside a premium zone on H4.
A simple rule:
- Higher timeframe (H4/Daily): Decide your market direction and check whether price is in the premium or discount zone of the larger range.
- Lower timeframe (M15/M5): Look for entries in the matching zone of the smaller range.
The best buy setups happen when price is in the discount zone on both the higher and lower timeframes.
Common Mistakes to Avoid
- Drawing Fibonacci on the wrong swing. Use a clear swing that broke structure and took liquidity not just any high or low.
- Drawing it backwards. Bullish: low to high. Bearish: high to low.
- Buying just because price is in discount. Discount shows where to look not when to enter. Wait for a PD array and a lower-timeframe CHoCH.
- Ignoring the higher timeframe. A “discount” on M5 can be deep premium on the Daily.
- Not updating the range. When price breaks the previous swing high and makes a new high draw the range again using the new swing.
Frequently Asked Questions
What is equilibrium in ICT?
Equilibrium is the 50% level of a price range. It separates premium and discount and price often reacts to it.
Is buying in discount always bullish?
Discount matters only when the higher timeframe is bullish. In a downtrend price may keep falling through discount instead of reversing.
Which Fibonacci levels does ICT use?
Mainly 0, 0.5 (equilibrium) 1 and OTE levels 0.62, 0.705 and 0.79. Extension levels like -0.27 and -0.62 can also be used as targets.
What’s the difference between premium/discount and support/resistance?
Support and resistance are fixed levels while premium and discount depend on the current price range and change when the range changes.
Conclusion
Premium and discount give you a simple filter for every trade:
- Buy in discount (below 50%) when the bias is bullish.
- Sell in premium (above 50%) when the bias is bearish.
- Equilibrium (50%) is the dividing line.
- Combine the zone with a PD array (order block or FVG) and a lower-timeframe CHoCH for precise entries.
Before your next trade ask yourself: “Am I buying low or buying high?” This simple question can improve your entries and risk-to-reward.
In the next article we’ll learn about Internal vs External Structure and how to spot a real trend change versus a normal pullback.
Risk Disclaimer: Trading forex, indices and other leveraged products involves high risk and may not be suitable for everyone. This article is for learning purposes only and is not financial advice.
Related Readings
1- Market Structure in SMC: BOS vs CHoCH Explained (With Chart Examples)
2- Buy-Side vs Sell-Side Liquidity: Where Smart Money Hunts Stops (With Chart Examples)
3- Step by Step Guide How to Backtest an MT5 EA Accurately Using Every Tick Data