The Secret Behind ICT Power of 3: Understanding Institutional Price Delivery
The Secret Behind ICT Power of 3: Understanding Institutional Price Delivery
The forex market can often seem unpredictable especially when the price breaks an important support or resistance level but then quickly moves in the opposite direction. Many traders enter these breakouts expecting the price to continue moving in the same direction but instead they end up on the wrong side of the market.
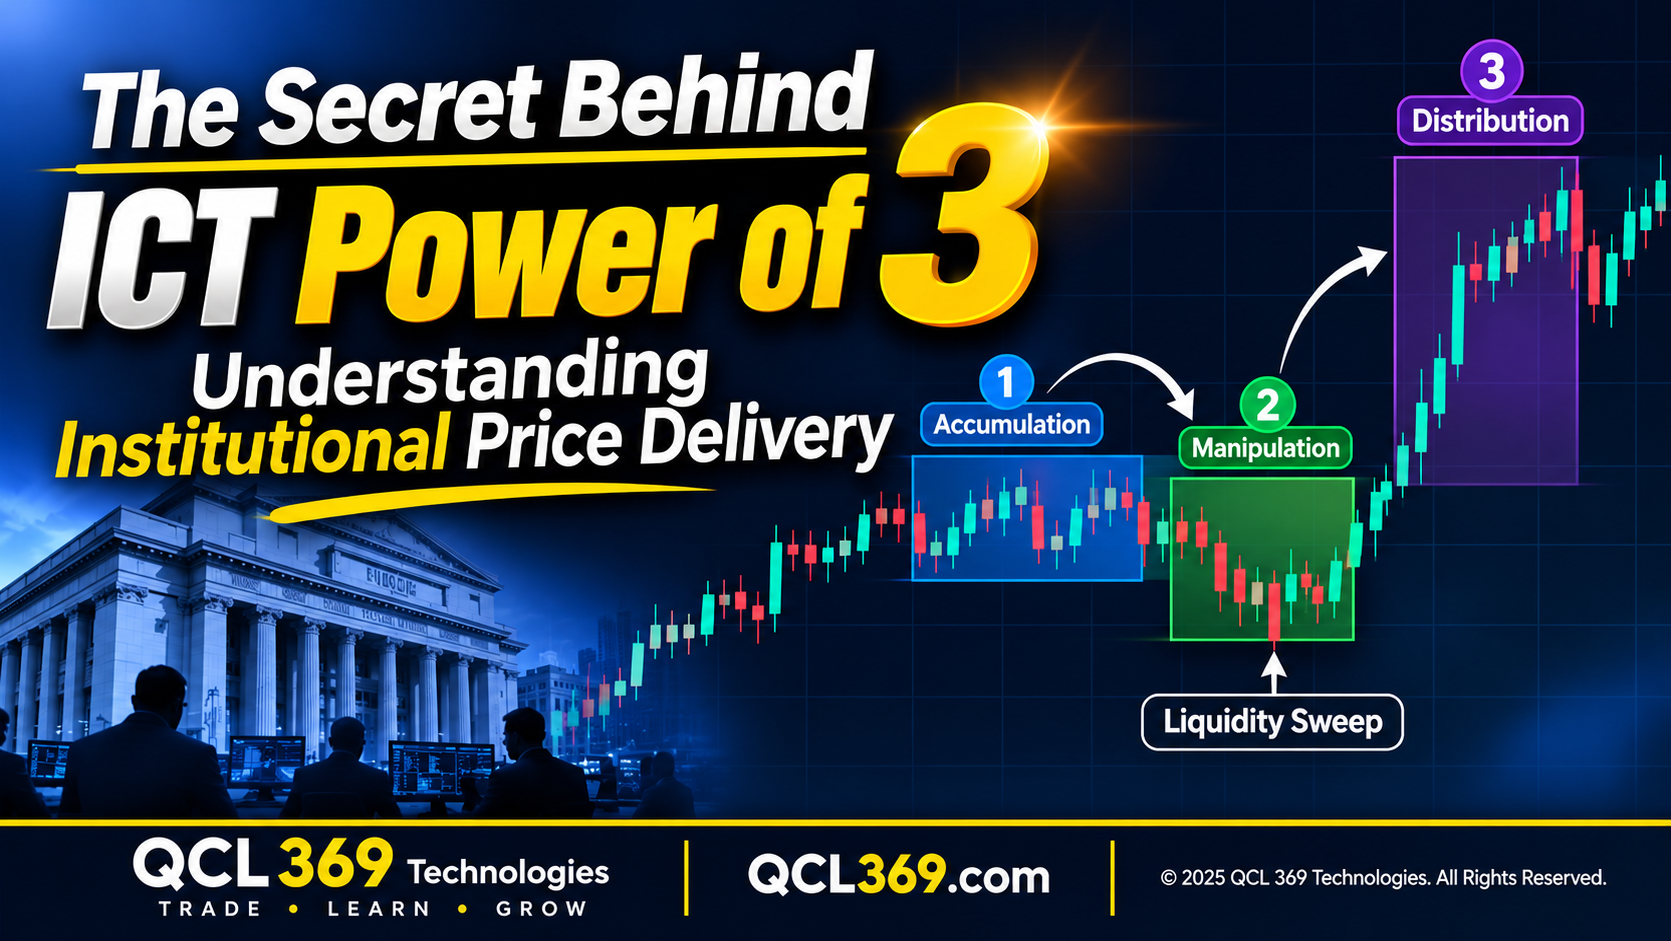
The ICT Power of 3 (PO3) explains these price movements through three stages Accumulation, Manipulation and Distribution (AMD). It helps traders spot possible liquidity sweeps understand how the market moves and identify chances for price to move strongly in one direction.
Instead of depending only on indicators or common chart patterns this concept focuses on how price moves around liquidity before possibly choosing a clear direction.
In this guide, we will explain how the ICT Power of 3 works, look at its three phases, and discuss how traders can use it in forex, gold and other financial markets.
What Is the ICT Power of 3?
The ICT Power of 3 is a trading concept developed as part of Michael J. Huddleston’s Inner Circle Trader methodology. It explains how price can move through three different stages:
- Accumulation: Price consolidates within a defined range.
- Manipulation: Price moves above or below the range which may trigger liquidity.
- Distribution: Price moves strongly in one direction often toward the other side of the range or another liquidity level.
These stages are commonly referred to as AMD.
The main idea is that price does not always move straight toward its target. It may first move sideways, take liquidity and then start moving in one clear direction.
EUR/USD may move sideways during the Asian session. When London opens, price drops below the Asian low, triggers sell stops then quickly reverses and moves higher.
An ICT trader may see this as price building up, taking sell side liquidity and then moving higher.
Understanding this pattern helps traders avoid fake breakouts and choose better entry points.
Understanding the Three Phases of ICT Power of 3
1. Accumulation: The Market Builds Its Range
Accumulation is the first stage of the Power of 3 model. In this phase price usually moves sideways in a small range without a clear trend.
Intraday traders often watch the Asian session for accumulation because major currency pairs usually move sideways during this time.
Traders commonly mark:
- Asian session high and low.
- Previous day’s high and low.
- Short-term swing highs and lows.
- Equal highs and equal lows.
- Important support and resistance levels.
These levels may hold liquidity because traders often place stop loss and pending orders near clear price levels.
For example, if GBP/USD moves between 1.2700 and 1.2730 traders may place buy stops above 1.2730 and sell stops below 1.2700.
An ICT trader watches these levels to see where price might go to collect liquidity in the next session.
During accumulation traders should not guess the market’s direction. They should mark the range and watch for a possible liquidity sweep.
2. Manipulation: The Liquidity Sweep
Manipulation is the second stage and one of the key parts of the ICT Power of 3 model.
In this stage price moves beyond one side of the range triggering stop loss orders and attracting traders who expect the breakout to continue in the same direction.
However price may quickly reverse and move back into the range.
For example GBP/USD moves between 1.2700 and 1.2730. During the London session price drops below 1.2700 takes sell side liquidity then reverses and moves higher.
This could represent a bullish liquidity sweep.
What should traders look for?
- Price moving beyond a previous session high or low.
- A quick rejection of the breakout area.
- Strong displacement in the opposite direction.
- A market structure shift (MSS).
- Formation of a fair value gap (FVG).
A liquidity sweep does not always mean a reversal. Price may break a key level and continue in the same direction. Traders should wait for confirmation before entering a trade.
3. Distribution: Directional Price Expansion
Distribution is the final phase of the Power of 3 model.
After accumulation and a possible liquidity sweep, price may move strongly in the opposite direction. In this phase a clear trend and market structure begin to form.
In the GBP/USD example after taking the Asian session low price moves back into the range and starts moving higher.
Traders may observe:
- Strong bullish or bearish displacement.
- A break of short-term market structure.
- Formation of fair value gaps.
- Movement toward previous session highs or lows.
- Expansion toward higher-timeframe liquidity.
This is where traders look for opportunities to participate in the directional move.
The key is to wait for price to show a strong move instead of guessing the reversal before it happens.
How the ICT Power of 3 Works Across Trading Sessions
The Power of 3 is often used in intraday trading because different sessions help traders spot accumulation and possible liquidity sweeps.
Asian Session: Accumulation
The Asian session often creates a trading range. Traders mark its high and low to watch for liquidity targets during the London and New York sessions.
London Session: Potential Manipulation
The London session often brings more activity to major forex pairs. Price may break above or below the Asian range before reversing or continuing in the same direction.
New York Session: Continuation or Reversal
The New York session may continue the London trend reverse the previous move or start a new strong move.
Not every trading day follows this pattern. Some days trend without a liquidity sweep while others stay consolidated. So, Power of 3 is a guide for market analysis not a fixed daily pattern.
How to Trade the ICT Power of 3 Strategy
Understanding the concept is just the beginning. Traders also need a clear plan to apply it in the market.
Here is a practical framework:
Step 1: Establish Your Higher Timeframe Bias
First check the 4 hour and 1 hour charts. Mark important highs and lows, market structure, fair value gaps and possible liquidity targets.
This helps traders decide whether to look for bullish or bearish setups.
Step 2: Identify the Accumulation Range
Mark the Asian session high and low or any important consolidation range. These levels help spot possible liquidity areas.
Step 3: Wait for a Liquidity Sweep
Watch if price moves above or below the range. For a bullish setup look for a sweep below the range low. For a bearish setup watch for a sweep above the range high.
Step 4: Confirm Market Structure Shift
After the sweep look for a strong price move and a market structure shift in the opposite direction. This may signal the start of a new trend.
Step 5: Look for a Fair Value Gap Entry
A fair value gap may form during a strong price move. Traders can wait for price to return to this area before looking for an entry in the direction of the move.
Step 6: Define Risk and Profit Targets
Place the stop loss at a technically justified invalidation level and identify realistic liquidity based profit targets.
For example:
- Entry: 1.2715
- Stop loss: 1.2695
- Risk: 20 pips
- Take profit: 1.2755
- Potential reward: 40 pips
- Risk-to-reward ratio: 1:2
This example shows how traders can manage risk before entering a trade. It does not guarantee profit.
Common Mistakes When Trading Power of 3

Although the concept is simple traders often make mistakes when identifying its different phases.
1. Treating Every Liquidity Sweep as a Reversal
Not every break of a session high or low leads to a reversal. Sometimes price continues in the same direction. Always wait for confirmation before entering a trade.
2. Ignoring Higher Timeframe Structure
A lower-timeframe setup may go against the main market trend. Always check the bigger market picture before trading.
3. Entering Before Manipulation Occurs
Trying to guess where price will reverse without waiting for a liquidity sweep and confirmation can lead to early entries.
4. Forcing the AMD Pattern
Not every trading session follows the full Accumulation-Manipulation-Distribution pattern. Don’t force this pattern onto normal market movements.
5. Ignoring Economic News
News events like CPI, NFP and FOMC can cause sudden price movements and affect trading setups. Always check the economic calendar.
6. Using Excessive Leverage
Even a good Power of 3 setup can fail. Use proper position sizing and set risk limits to protect your trading capital.
Can ICT Power of 3 Be Used for Gold and Forex?
Yes. The Power of 3 framework can be applied to major forex pairs gold (XAUUSD) and stock indices.
In forex traders commonly monitor Asian session ranges and potential London session liquidity sweeps.
In gold trading, XAUUSD can move sharply during major news events and active market sessions. Watching session highs and lows, strong price moves and fair value gaps can help spot potential trading setups.
For indices like NAS100 and US30 traders can watch premarket liquidity and price movements around the New York session open.
Each market has different levels of volatility. Traders should adjust their position size and stop loss distance accordingly.
Final Thoughts: Understanding Institutional Price Delivery
The ICT Power of 3 helps traders understand how price can move from consolidation to liquidity sweeps and then into a strong directional move.
By understanding accumulation, manipulation and distribution traders can analyze the market in a more organized way.
The real value of this concept is not just knowing the three phases, but understanding how liquidity, market structure, price movement and timing work together.
The market does not always follow the AMD pattern and a liquidity sweep does not guarantee a reversal. Traders should wait for confirmation follow their trading plan and manage risk properly.
Mastering the ICT Power of 3 means learning to understand when the market might change direction or move differently instead of blindly trading every breakout or reversal.
Frequently Asked Questions (FAQs)
1. What is the ICT Power of 3?
ICT Power of 3 has three phases Accumulation, Manipulation and Distribution (AMD). It shows how price ranges, grabs liquidity and then moves in a direction.
2. What does AMD mean in ICT trading?
AMD means Accumulation, Manipulation and Distribution. These are the three stages of price movement in the ICT Power of 3 model.
3. What is the manipulation phase in Power of 3?
Manipulation happens when price breaks out of a range to grab liquidity, trap traders and then possibly reverse direction.
4. What is the best timeframe for ICT Power of 3?
No timeframe is best for everyone. Use 4 Hour and 1 Hour for trend, 15 Minute for analysis and 5 Minute or 1 Minute for entries.
5. Does ICT Power of 3 work on XAUUSD?
Yes, traders can use the Power of 3 strategy on gold by watching session ranges, liquidity sweeps, and market structure. But gold needs careful risk management because of its high volatility.
6. Is ICT Power of 3 a profitable strategy?
It’s a trading concept not a guaranteed way to make profit. Success depends on market conditions proper entry, confirmation and risk management.