👤 By Aqsa Ahsan
ICT & Smart Money
How to Trade Accumulation, Manipulation and Distribution
How to Trade Accumulation, Manipulation and Distribution
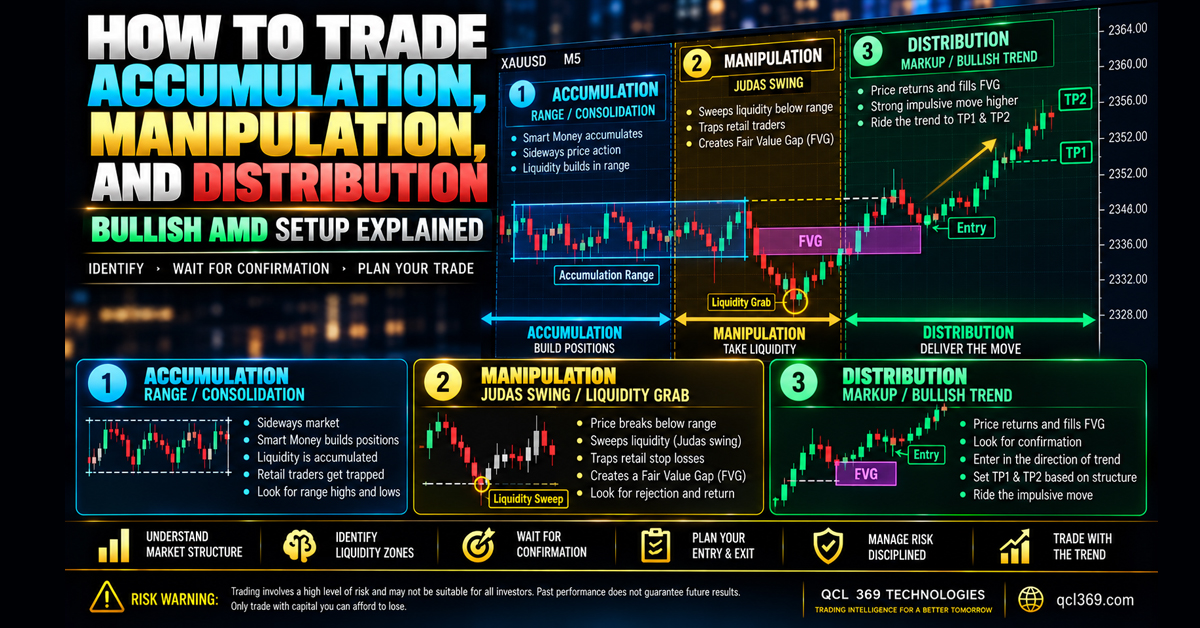
In modern institutional trading and SMC price doesn’t move randomly. Large institutions need millions of dollars in opposite side liquidity to fill their huge orders without moving the price against themselves too early.
To create this liquidity institutions move price through a common 3 phase cycle called AMD Accumulation, Manipulation and Distribution. In Inner Circle Trader ICT this is also known as the Power of 3 (PO3).
Understanding AMD helps traders avoid buying at the top or selling at the bottom and instead trade in the direction of institutional volume.
What is Accumulation, Manipulationand Distribution (AMD)?
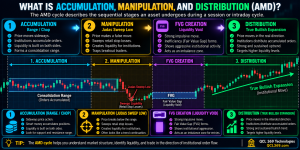
The AMD cycle shows the different stages an asset goes through during a trading session.
1. Accumulation (The Setup)
-
Market Behavior: Price moves in a narrow, horizontal range with compressed volatility.
-
The Retail Trap: Retail traders see equal highs and lows placing buy stops above the range and sell stops below it.
-
The Institutional Objective: Smart money builds positions while orders gather just outside the range.
2. Manipulation (The “Judas Swing”)
-
Market Behavior: A sudden sharp breakout happens against the true market direction.
-
The Retail Trap: In a bullish setup price drops below the accumulation low. Retail traders open shorts while earlier buyers’ stop losses get triggered.
-
The Institutional Objective: This false move called the Judas Swing takes out sell side liquidity (SSL) below the lows. Institutions use this forced selling to buy at lower prices.
3. Fair Value Gap (FVG) Displacement & Distribution
-
The Imbalance (FVG): After absorbing liquidity institutions push price sharply upward breaking market structure (MSS). This move creates a 3 candle imbalance called a FVG.
-
Distribution (The Trend): Price briefly retests the fresh FVG then moves strongly toward opposing liquidity (equal highs, previous daily highs or take profit levels) where institutions take profits.
Automated AMD Recognition with QCL AI Scalper MT5
Finding the end of accumulation the exact manipulation low and the 1 minute FVG retest in real time can be difficult and overwhelming for traders.
The QCL AI Scalper MT5 Indicator has a PO3/AMD Strategy Engine that automatically detects the cycle and shows each stage directly on MetaTrader 5.
Phase Breakdown Tracking Accumulation, Manipulation & FVG Creation
The indicator continuously scans the chart identifies structural consolidation and marks the manipulation sweep in real time.
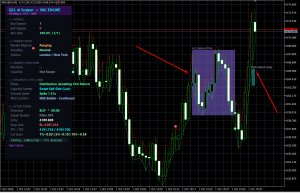
Caption: Image 1 QCL AI Scalper automatically detects the Accumulation box (purple) Manipulation sweep Market Structure Shift (MSS) and FVG retest zone.
┌─────────────────────────────As demonstrated in Image 1:
-
Automated Accumulation Shading: The engine marks the active accumulation range with a purple box from $4,160 to $4,168.
-
Manipulation Sweep (SSL Swept): Price drops below the box and sweeps sell side liquidity down to $4,156. The dashboard shows a confirmed sell side liquidity sweep and a 1.51× volume spike.
-
Displacement & FVG Mapping: Price surges upward, breaking the manipulation high and confirming a Bullish MSS. The engine detects the FVG retest zone at $4,164–$4,165.60 and updates the dashboard to Distribution Awaiting FVG Retest.
The Execution Mitigation Retest & Distribution to TP1
Once the FVG is mapped the indicator waits for price to pull back into the imbalance instead of chasing the move. It then provides an execution setup.
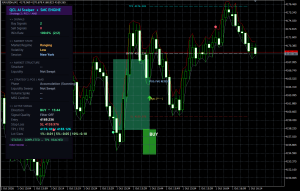
Caption: Image 2 Price pulls back into the FVG zone triggering a confirmed BUY signal that moves cleanly toward TP1.
==============================As shown in Image 2:
-
Mitigation Retest: Price pulls back into the green FVG zone, absorbing the remaining imbalances without breaking structural lows.
-
Instant Signal Anchor: As the candle rejects the FVG and closes bullishly, the software locks in a permanent BUY Arrow tagged
PO3: FVG RETESTat 4169.236. -
Zero Guesswork Risk Levels: The indicator automatically sets the Stop Loss at 4,159.976 and calculates the lot size on the dashboard (1% = 0.01, 5% = 0.05, 10% = 0.10).
-
Target Delivery: Price moves sharply upward and reaches TP1 at 4,176.181 giving a 100% win rate 2/2 and showing COMPLETED TP1 REACHED.
Key Takeaways for Trading AMD
-
Never Trade the Initial Breakout: The first strong move out of an accumulation range is often an institutional manipulation sweep that targets stop losses.
-
Look for Structural Imbalances: A real reversal creates a Fair Value Gap (FVG) through strong institutional price movement.
-
Enter on Mitigation: Wait for price to retest the FVG then enter in the direction of the main move.
-
Automate the Process: Use tools like the QCL AI Scalper MT5 Indicator to map the accumulation range track manipulation sweeps and automatically calculate lot size and risk on your charts.
Tags: Accumulation Manipulation Distribution AI Trading Indicator AMD Trading Strategy Bitcoin Trading Strategy Crypto Trading Forex Scalper Forex Trading Gold Scalping How to Trade Accumulation ICT Concepts Liquidity Sweep Manipulation MetaTrader 5 Indicator MT5 Indicator Order Block Power of 3 Price Action QCL AI Scalper Scalping Strategy Smart Money Concepts SMC Trading XAUUSD Trading