👤 By Aqsa Ahsan
ICT & Smart Money
How to Spot the ICT Power of 3 (PO3)?
How to Spot the ICT Power of 3 (PO3)?
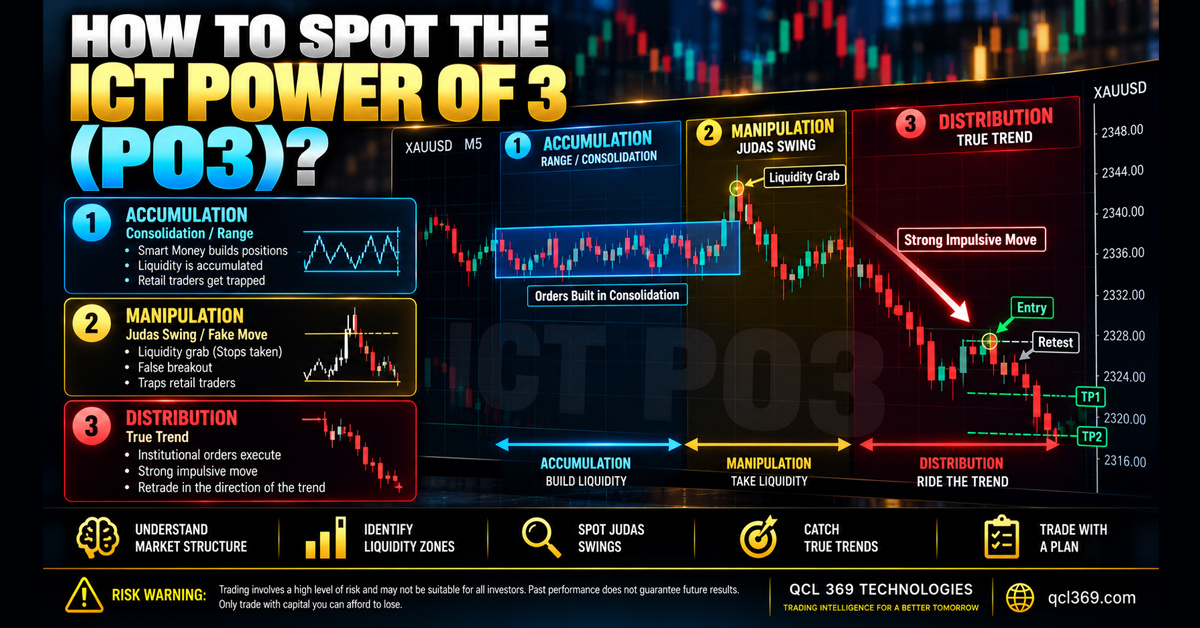
In SMC and ICT the Power of 3 (PO3) also known as AMD (Accumulation, Manipulation, Distribution) is a price delivery model.
Retail traders often buy at the exact high or short at the exact low because institutional algorithms make fake moves to trigger retail stop orders before pushing price toward the real daily target.
Understanding each phase of the PO3 cycle helps traders avoid market traps and trade in line with institutional order flow.
How to Spot the Power of 3 (AMD Cycle) on Your Chart
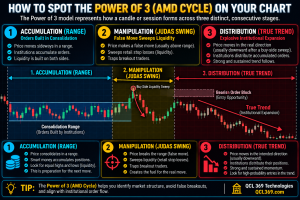
The Power of 3 model shows how a candle or session forms in three clear stages:
1. Phase 1: Accumulation
-
What Happens: The session starts with a tight sideways range and low volume often seen during Asian hours or quiet pre market periods.
-
The Institutional Goal: Market makers build their positions while retail traders place buy stop and sell stop orders above and below the range.
2. Phase 2: Manipulation (The Judas Swing)
-
What Happens: Price breaks sharply against the true institutional direction. On a bullish day price suddenly drops below the accumulation lows.
-
The Retail Trap: Retail traders think the downtrend has started and rush to short while earlier buyers get stopped out.
-
The Institutional Goal: This fake move, called the Judas Swing, sweeps sell side liquidity (SSL) below the accumulation range. Institutions use the selling pressure to fill large buy orders at lower prices.
3. Phase 3: Distribution
-
What Happens: Once liquidity is taken price sharply reverses breaks market structure (MSS/BOS) and moves strongly in the main direction.
-
The Institutional Goal: Institutional money pushes price toward liquidity areas like equal highs previous daily highs or imbalances to close positions in profit.
Key Checkpoints to Identify a Valid PO3 Setup
-
Time & Session Alignment: A true Judas Swing usually happens around major institutional opens like the London Open 07:00–09:00 GMT or the New York open overlap.
-
The Liquidity Sweep: The manipulation wick must sweep the previous accumulation high or low before price shows a clear structure break.
-
Market Structure Shift (MSS): Never buy a falling knife. A valid PO3 reversal needs a strong close through local market structure confirming the sweep is over and distribution has started.
Automating PO3 Detection with the QCL AI Scalper MT5 Indicator
Tracking the shift from Accumulation to Manipulation on fast M1 or M5 charts can cause hesitation. Spotting when the Judas Swing ends and true distribution begins requires real time monitoring.
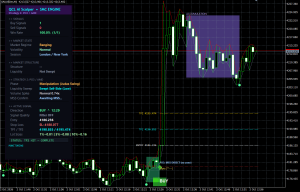
The QCL AI Scalper MT5 Indicator has a built in PO3/AMD Strategy Engine that tracks institutional order flow and shows each phase directly on your chart.
┌─────────────────────────────
How the Engine Automates the Trade
-
Automated Accumulation Shading: The indicator marks the active accumulation zone with a purple box, clearly showing the range where orders are building.
-
Live Phase Tracking: The dashboard shows the current phase such as Manipulation (Judas Swing) and confirms liquidity sweeps like a sell side sweep below the low.
-
Direct MSS Confirmation: Instead of guessing if the pullback will continue the engine waits for a Market Structure Shift (MSS Direct) at candle close before sending an alert.
-
Instant Dynamic Execution Blueprint: The system automatically shows Entry stop loss TP1 and TP2 on the chart along with a real time risk calculator.
Live Chart Breakdown M1 Gold (XAUUSD) PO3 Judas Swing & Distribution
The live XAUUSD (Gold) M1 execution shows the full cycle of a textbook Power of 3 setup:
==============================1. The Setup Asian Pre Market Accumulation
Price moved sideways for hours inside the purple zone above 4205.50. Traders placed orders on both sides creating stop liquidity above and below the range.
2. Manipulation (Judas Swing)
During the active overlap session algorithms drove price sharply from 4205 to below 4180. Retail buyers were stopped out while breakout traders opened short positions near the lows.
The QCL AI Scalper tracked the move marked it as Phase manipulation Judas Swing and confirmed a sell side liquidity sweep. It stayed quiet helping traders avoid entering too early.
3. MSS Confirmation & Distribution Expansion
After institutional buy orders absorbed the retail stops price formed a strong rejection wick and closed with a bullish candle.
- The indicator detected the structure shift and marked the candle as PO3 MSS DIRECT (no zone).
- At the 12:29 candle close a green BUY Arrow appeared setting Entry at 4186.236 Stop Loss at 4180.077 TP1 at 4190.855 and TP2 at 4195.474.
- The dashboard instantly calculated lot sizes (1% = 0.01, 5% = 0.08, 10% = 0.16) allowing quick order entry.
4. Target Delivery
The trade quickly entered Phase 3 (Distribution). Price surged upward with consecutive strong bullish candles.
-
TP1 ($4190.855) was hit on the first push allowing 50% of the position to be closed in profit.
- Price continued higher through TP2 ($4195.474) completing the trade (TP2 HIT COMPLETE) and reaching the upper accumulation liquidity zone above 4220.
Core Rules for Trading the Power of 3
-
Never Trade Inside the Accumulation Range: Wait for the range to form and identify where retail stops are placed.
-
Expect the Judas Swing: Expect a false move at session open that sweeps liquidity before the real trend starts.
-
Wait for MSS Confirmation: Don’t guess the sweep’s bottom enter only after a confirmed Market Structure Shift on candle close.
-
Automate the Blueprint: Use tools like the QCL AI Scalper MT5 Indicator to map ranges detect liquidity sweeps and size lots dynamically for disciplined execution.
Tags: Accumulation Manipulation Distribution AMD Setup Bitcoin Scalping Crypto Trading Day Trading Strategy Forex Indicators Forex Scalping Forex Trading Gold Scalping ICT Power of 3 Judah Swing Liquidity Sweep MetaTrader 5 MT5 Indicator Order Flow PO3 Strategy QCL AI Scalper Smart Money Concepts SMC Trading XAUUSD Trading